Fig. 6.
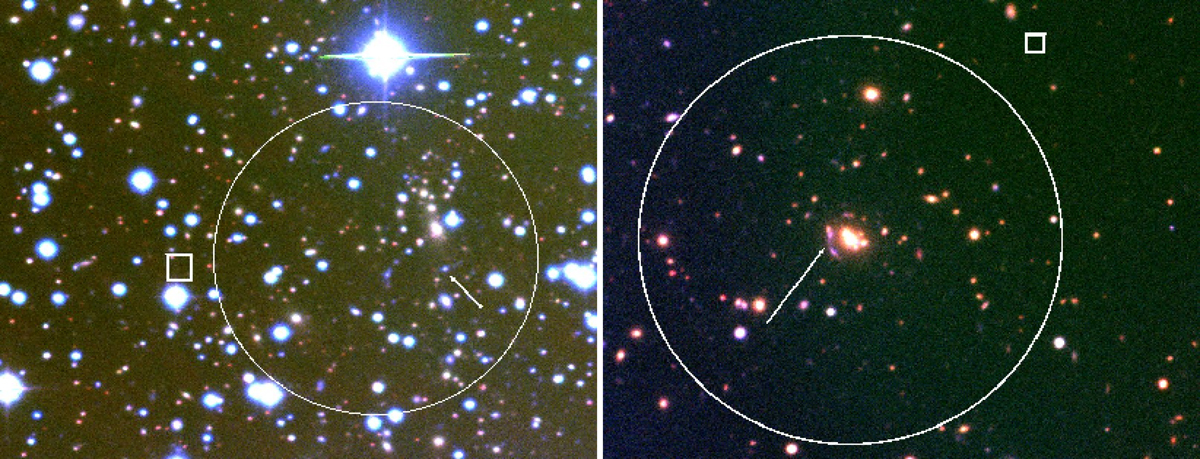
RGB images obtained with the WFC/INT (left) and ACAM/WHT (right) g′, r′, and i′ frames of the SZ sources PSZ1 G063.92−16.75 and PSZ1 G158.34−47.49, respectively. The squares indicate the corresponding SZ Planck coordinates, while the arrows point to the blue gravitational arcs detected in the core of the clusters. The circle is a 1.2′ radius region including the brightest galaxies of each cluster.
Current usage metrics show cumulative count of Article Views (full-text article views including HTML views, PDF and ePub downloads, according to the available data) and Abstracts Views on Vision4Press platform.
Data correspond to usage on the plateform after 2015. The current usage metrics is available 48-96 hours after online publication and is updated daily on week days.
Initial download of the metrics may take a while.