Fig. 4.
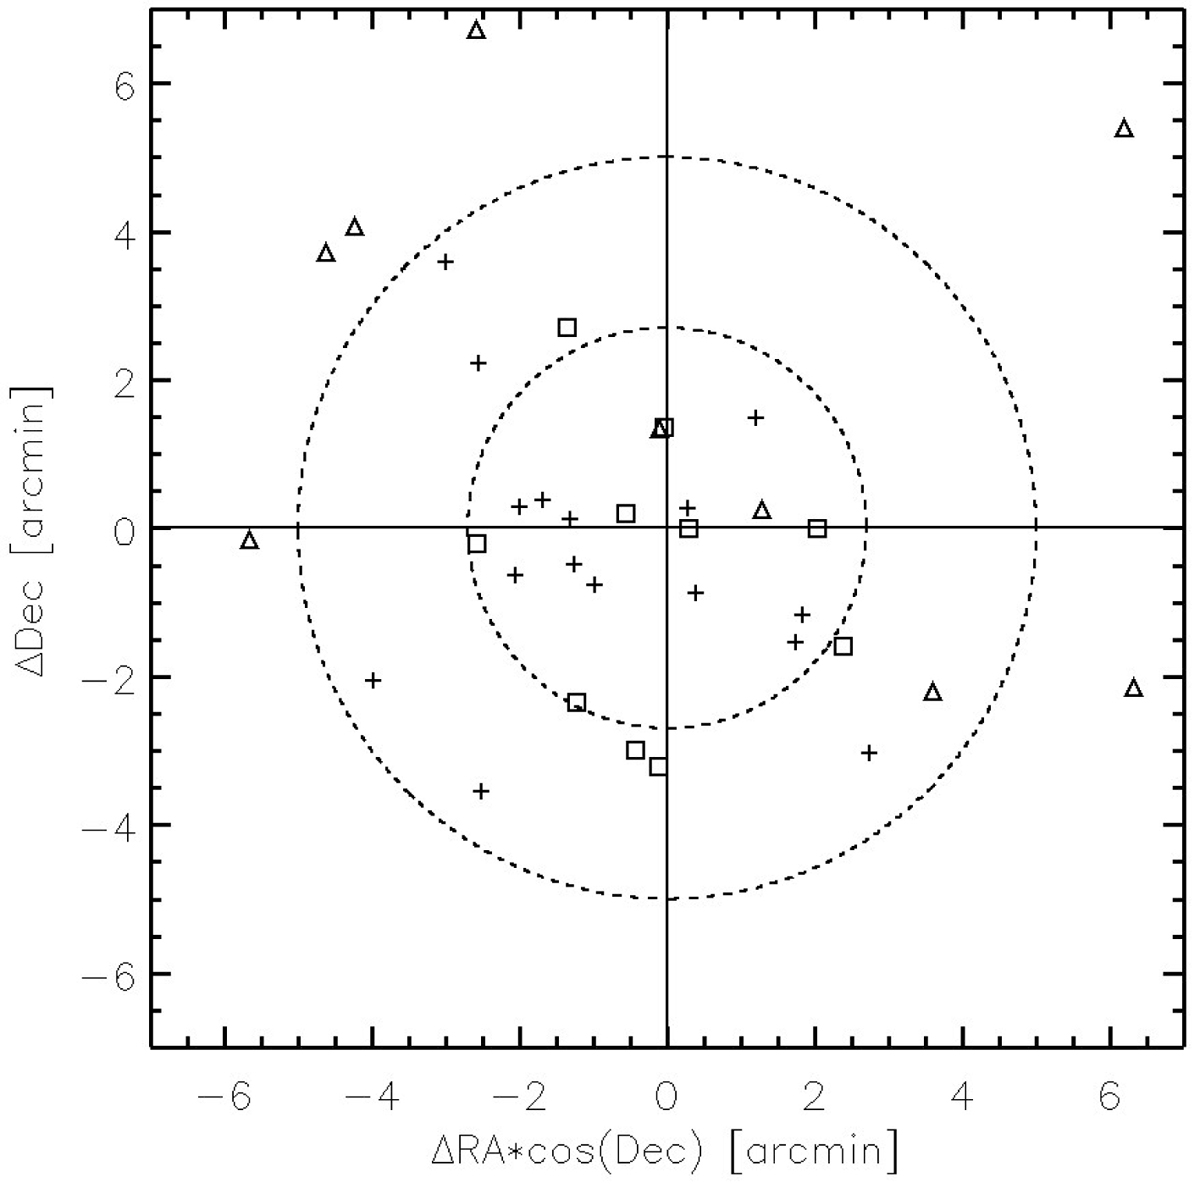
Spatial distribution of optical centres with respect to their corresponding PSZ1 coordinates. Crosses, squares, and triangles correspond to clusters flagged as 1, 2, and 3, respectively. The inner dashed circle marks the 2.8′ radius region where 68% of the confirmed clusters are enclosed. The external dashed circle corresponds to the beam size (5′) of SZ Planck detections.
Current usage metrics show cumulative count of Article Views (full-text article views including HTML views, PDF and ePub downloads, according to the available data) and Abstracts Views on Vision4Press platform.
Data correspond to usage on the plateform after 2015. The current usage metrics is available 48-96 hours after online publication and is updated daily on week days.
Initial download of the metrics may take a while.