Fig. 2.
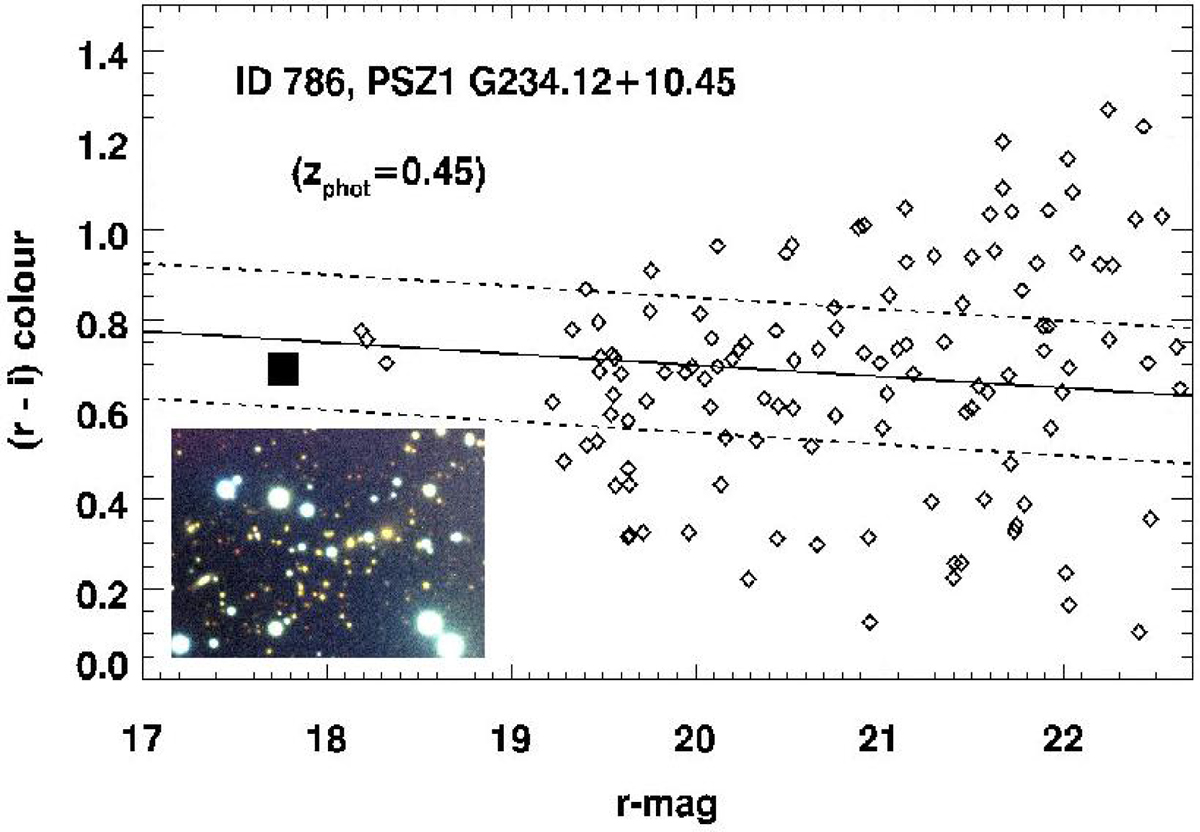
(r′−i′,r′) CMD of the source PSZ1 G234.12+10.45. Only extended sources within a region of ![]() (∼1.3 × 1.1 Mpc) around the BCG (large filled square) are considered. The RS (solid line) fit yields a zphot = 0.45. Dashed lines limit the RS ± 0.15 mag of likely cluster members. A colour composite image (built using the g′, r′, and i′ frames with 3′×2.5′ FOV) is shown superimposed on the diagram.
(∼1.3 × 1.1 Mpc) around the BCG (large filled square) are considered. The RS (solid line) fit yields a zphot = 0.45. Dashed lines limit the RS ± 0.15 mag of likely cluster members. A colour composite image (built using the g′, r′, and i′ frames with 3′×2.5′ FOV) is shown superimposed on the diagram.
Current usage metrics show cumulative count of Article Views (full-text article views including HTML views, PDF and ePub downloads, according to the available data) and Abstracts Views on Vision4Press platform.
Data correspond to usage on the plateform after 2015. The current usage metrics is available 48-96 hours after online publication and is updated daily on week days.
Initial download of the metrics may take a while.