Fig. 11.
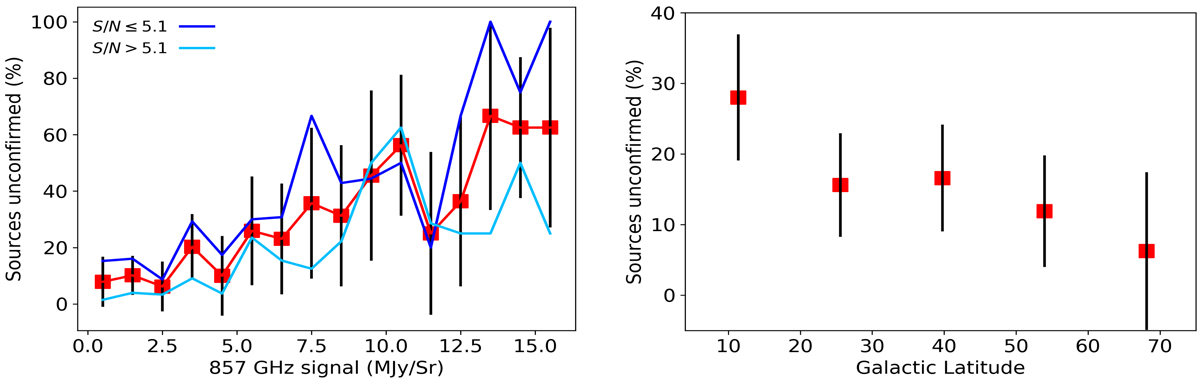
Left panel: fraction of unconfirmed sources with respect to the total number of elements of the PSZ1-North sample (Dec ≥ −15°) as a function of the 857 GHz signal in MJy sr−1 taking into account the entire sample (red squares), the S/N < 5.1 subsample (dark blue line), and the S/N ≥ 5.1 subsample (light blue line). Right panel: percentage of unconfirmed sources with respect the total number of elements of the PSZ1-North sample as a function of the galactic latitude. The error bars represents the Poisson uncertainty of the total number of sources in each bin.
Current usage metrics show cumulative count of Article Views (full-text article views including HTML views, PDF and ePub downloads, according to the available data) and Abstracts Views on Vision4Press platform.
Data correspond to usage on the plateform after 2015. The current usage metrics is available 48-96 hours after online publication and is updated daily on week days.
Initial download of the metrics may take a while.