Fig. A.4.
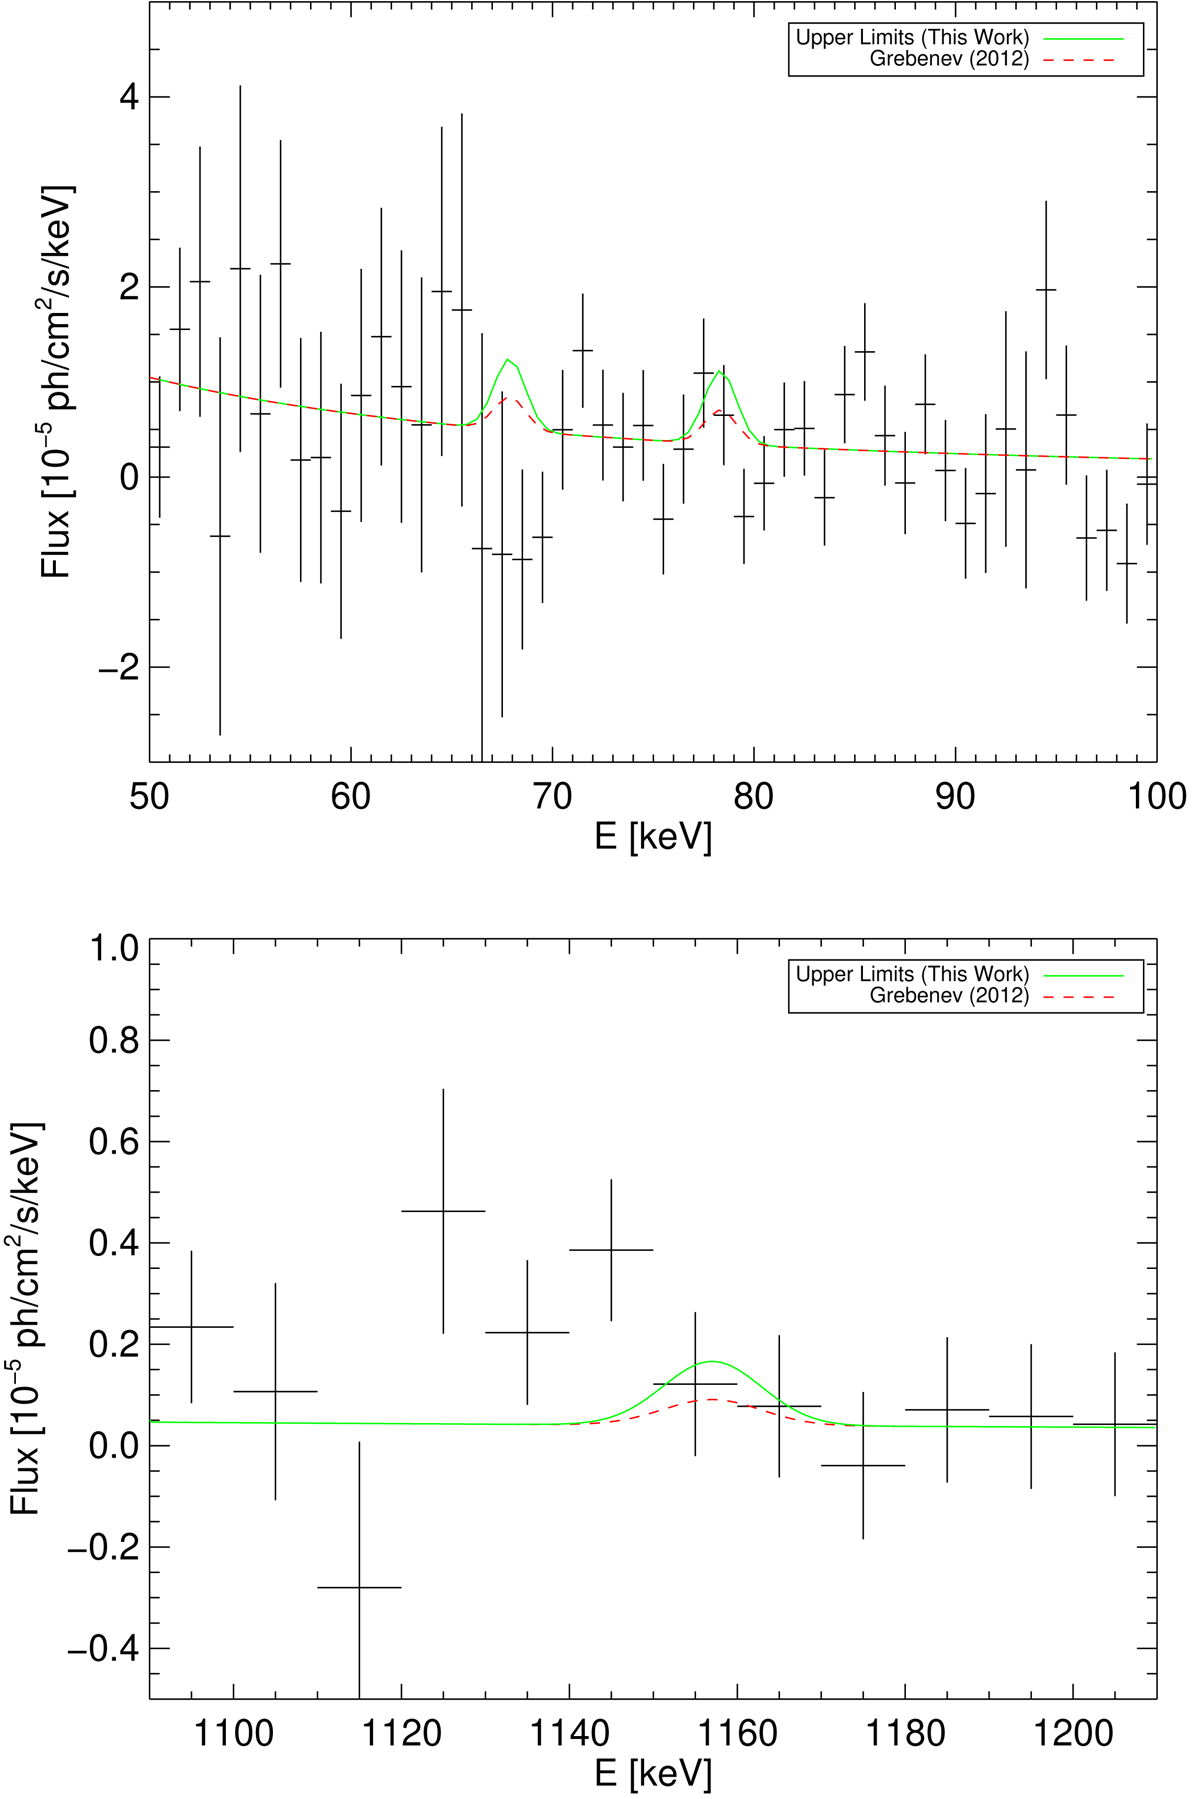
Upper panel: spectrum in the energy range from 50–100 keV for a source at celestial position of SN 1987A. The spectrum is fit with a power law accounting for the emission of LMC-X1 and PSR B0540-69, which are spatially indistinguishable from SN 1987A. The green line shows the power-law continuum and the 2σ line limits. Lower panel: same as upper panel but for energy range 1090–1210 keV. We allow for a constant offset to account for possible diffuse emission sources located within the 2.7° angular resolution of SPI. We do not find significant flux excess for any of the 44Ti decay lines. The 2σ upper-limit flux determined for an expansion velocity of 3000 km s−1 is 1.8 × 10⁻⁵ ph cm−2 s−1 corresponding to 7.0 × 10⁻⁴ M⊙ synthesized 44Ti (green line). Red dashed line corresponds to the IBIS flux (Grebenev et al. 2012) as it would be seen in SPI data.
Current usage metrics show cumulative count of Article Views (full-text article views including HTML views, PDF and ePub downloads, according to the available data) and Abstracts Views on Vision4Press platform.
Data correspond to usage on the plateform after 2015. The current usage metrics is available 48-96 hours after online publication and is updated daily on week days.
Initial download of the metrics may take a while.