Fig. 3.
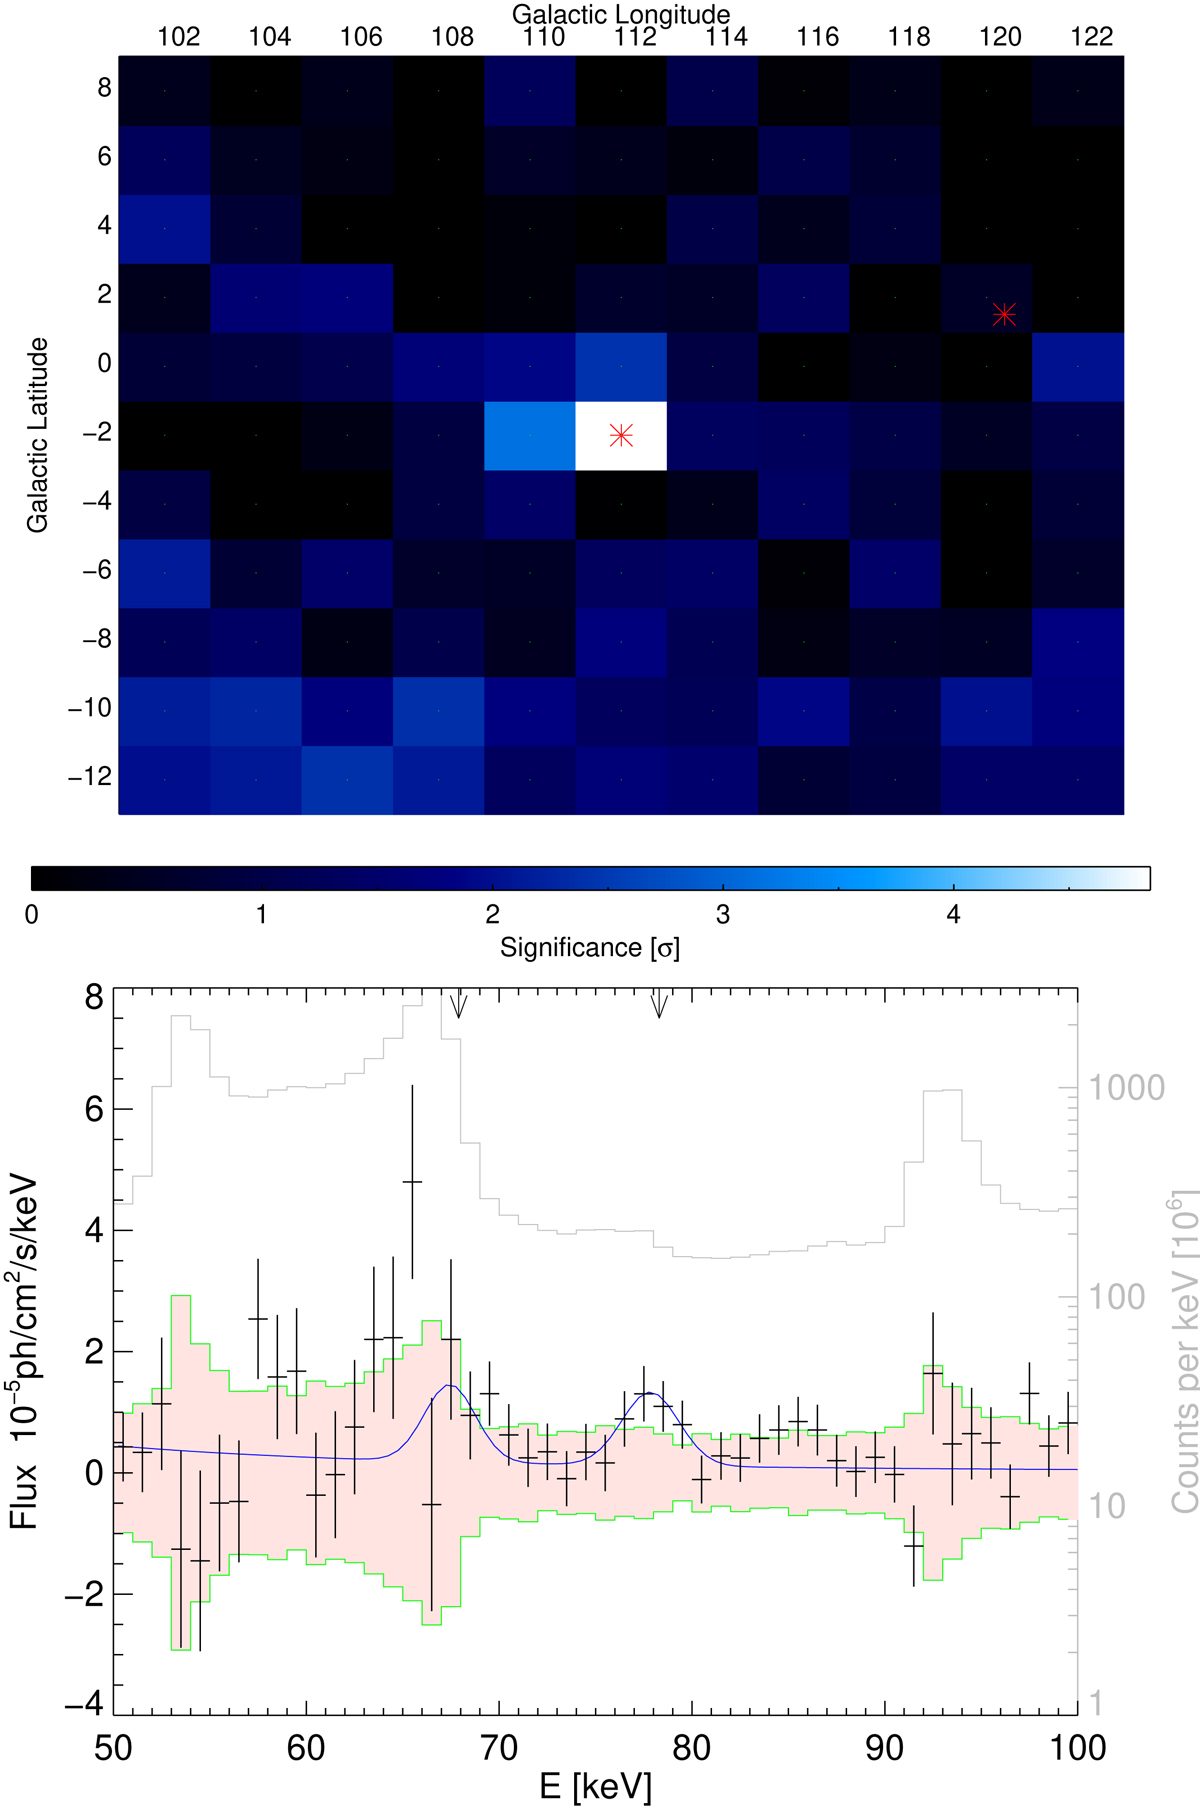
Upper panel: significance map of 44Ti decay evaluated for the 78 and 1157 keV line with color-coding in significance levels. Excess at the 4.9σ level is only found at the location of Cassiopeia A (center). The second red cross marks the location of Tycho’s supernova remnant. Lower panel: spectrum of Cassiopeia A is shown in black. The red shaded area contains the uncertainty band from the spectra obtained in a 20° ×20° area centered at Cassiopeia A. The gray spectrum shows the mission integrated background. It is evident that the uncertainty scales with the strength of the background leading to an increased uncertainty in the region 50–65 keV. Arrows indicate the laboratory-determined centroid energies of both 44Ti decay lines. Clustered excess over the uncertainty band is found in the vicinity of the 78 keV line. Unfortunately, the 68 keV emission is located at the edge of a strong background line complex allowing for only a marginal detection probability of the line.
Current usage metrics show cumulative count of Article Views (full-text article views including HTML views, PDF and ePub downloads, according to the available data) and Abstracts Views on Vision4Press platform.
Data correspond to usage on the plateform after 2015. The current usage metrics is available 48-96 hours after online publication and is updated daily on week days.
Initial download of the metrics may take a while.