Fig. 2.
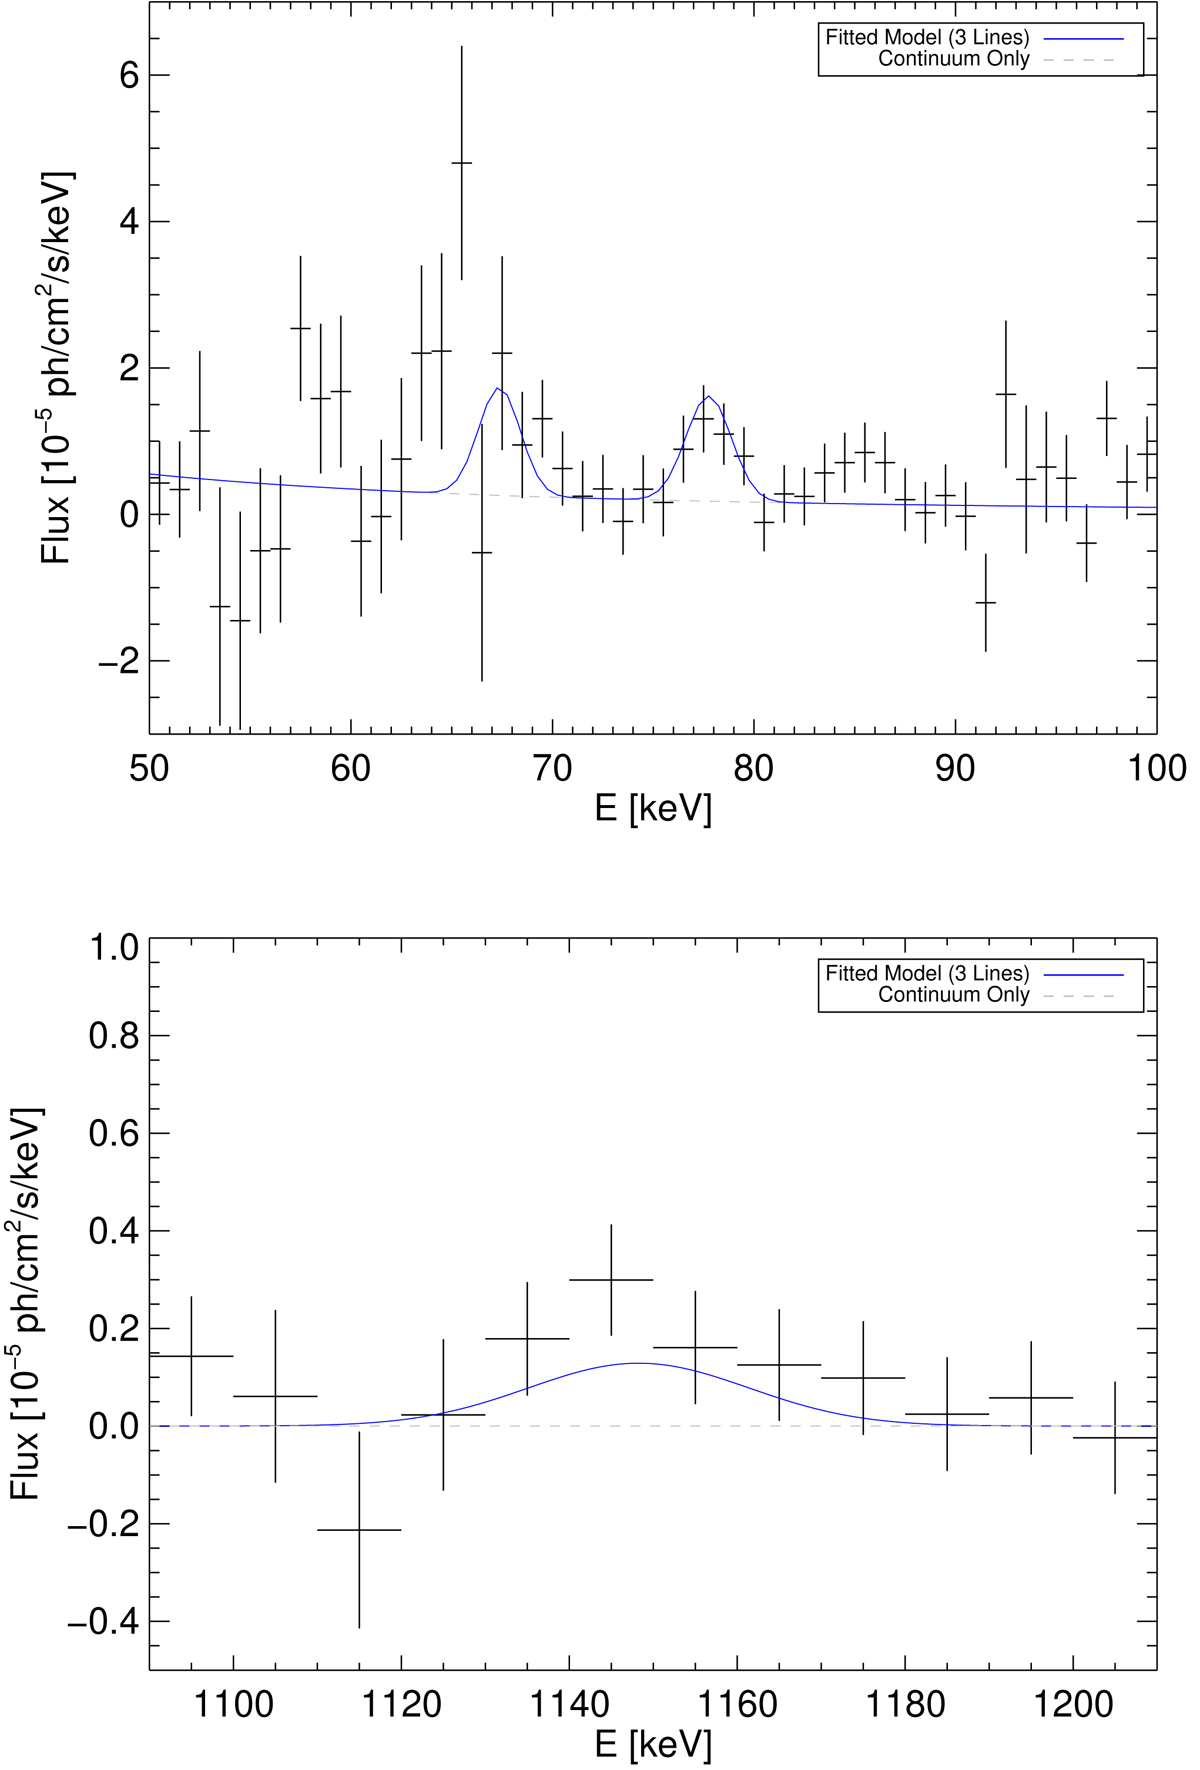
Spectra for Cassiopeia A in the energy region 50–100 keV in 1 keV binning and 1090–1210 keV in 10 keV binning containing all potential decay lines from the decay chain of 44Ti. We fit the spectrum with a power law accounting for underlying continuum most likely produced by synchrotron emission at the shock front and Gaussian shaped line profiles in each region. The lines are Doppler shifted and broadened, which cannot solely be explained by the instrumental resolution at the energies, respectively. The lines are determined from a combined fit. This means that we fit one uniform power law over the entire energy range and identical Doppler parameters and integrated flux values for all three lines simultaneously. Flux values are corrected for the respective branching ratios of the lines.
Current usage metrics show cumulative count of Article Views (full-text article views including HTML views, PDF and ePub downloads, according to the available data) and Abstracts Views on Vision4Press platform.
Data correspond to usage on the plateform after 2015. The current usage metrics is available 48-96 hours after online publication and is updated daily on week days.
Initial download of the metrics may take a while.