Fig. 1.
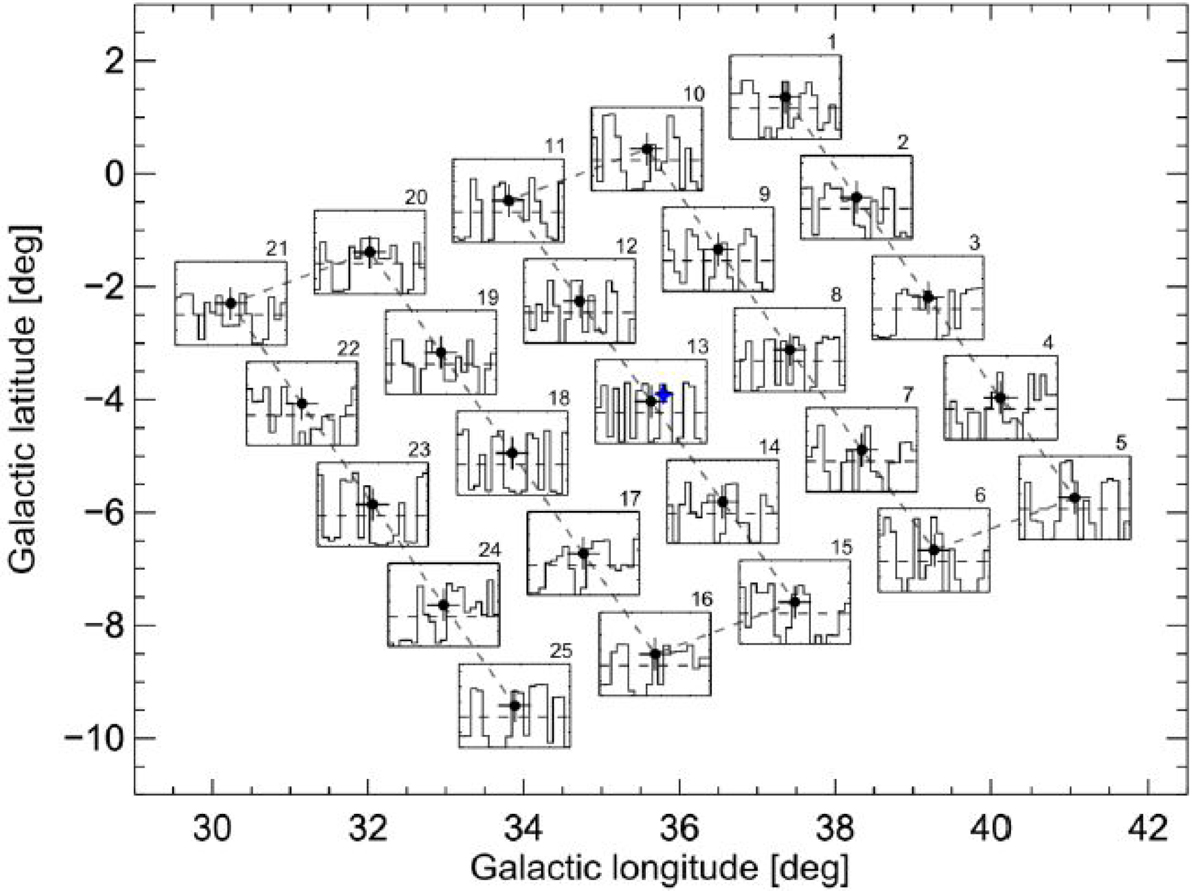
Intensity distribution of a celestial source located at the center of the plot (blue dot) (Siegert et al. 2019). The orientation of the SPI instrument is changed in steps of two degrees to visit the locations marked on the map with black dots. The instrument remains centered on each celestial position for ≈2000s, which is called “one pointing”. The source located at the blue position is folded through the instrumental response function to determine the intensity distribution in the detector plane.
Current usage metrics show cumulative count of Article Views (full-text article views including HTML views, PDF and ePub downloads, according to the available data) and Abstracts Views on Vision4Press platform.
Data correspond to usage on the plateform after 2015. The current usage metrics is available 48-96 hours after online publication and is updated daily on week days.
Initial download of the metrics may take a while.