Free Access
Fig. 5.
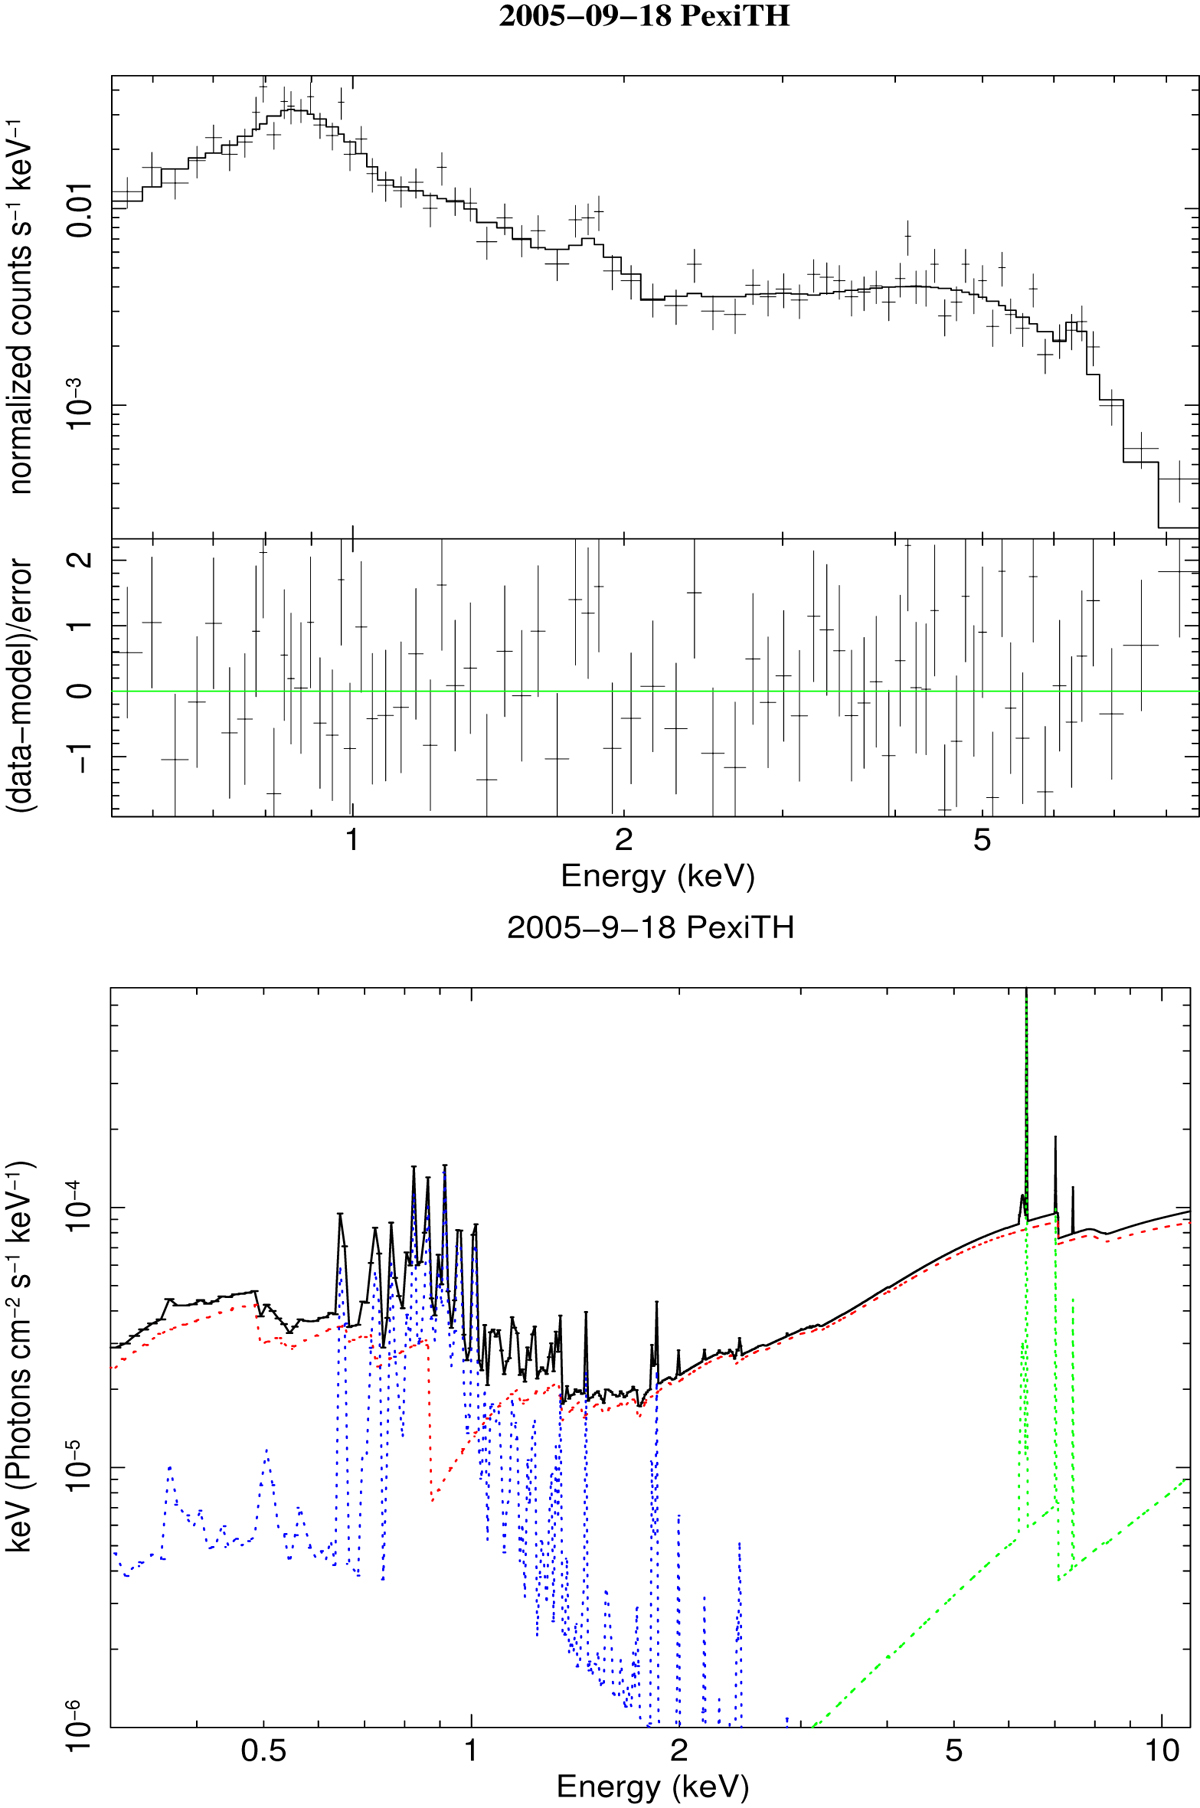
Chandra spectrum of the nucleus (from the observation of 2005 September 18) fitted with the PexiTH model (black line). The model components are shown in the lower panel. The red line is the absorbed power law from the nucleus, the green line is the pexmon model, and the blue line is the mekal component from the galaxy.
Current usage metrics show cumulative count of Article Views (full-text article views including HTML views, PDF and ePub downloads, according to the available data) and Abstracts Views on Vision4Press platform.
Data correspond to usage on the plateform after 2015. The current usage metrics is available 48-96 hours after online publication and is updated daily on week days.
Initial download of the metrics may take a while.