Fig. 4.
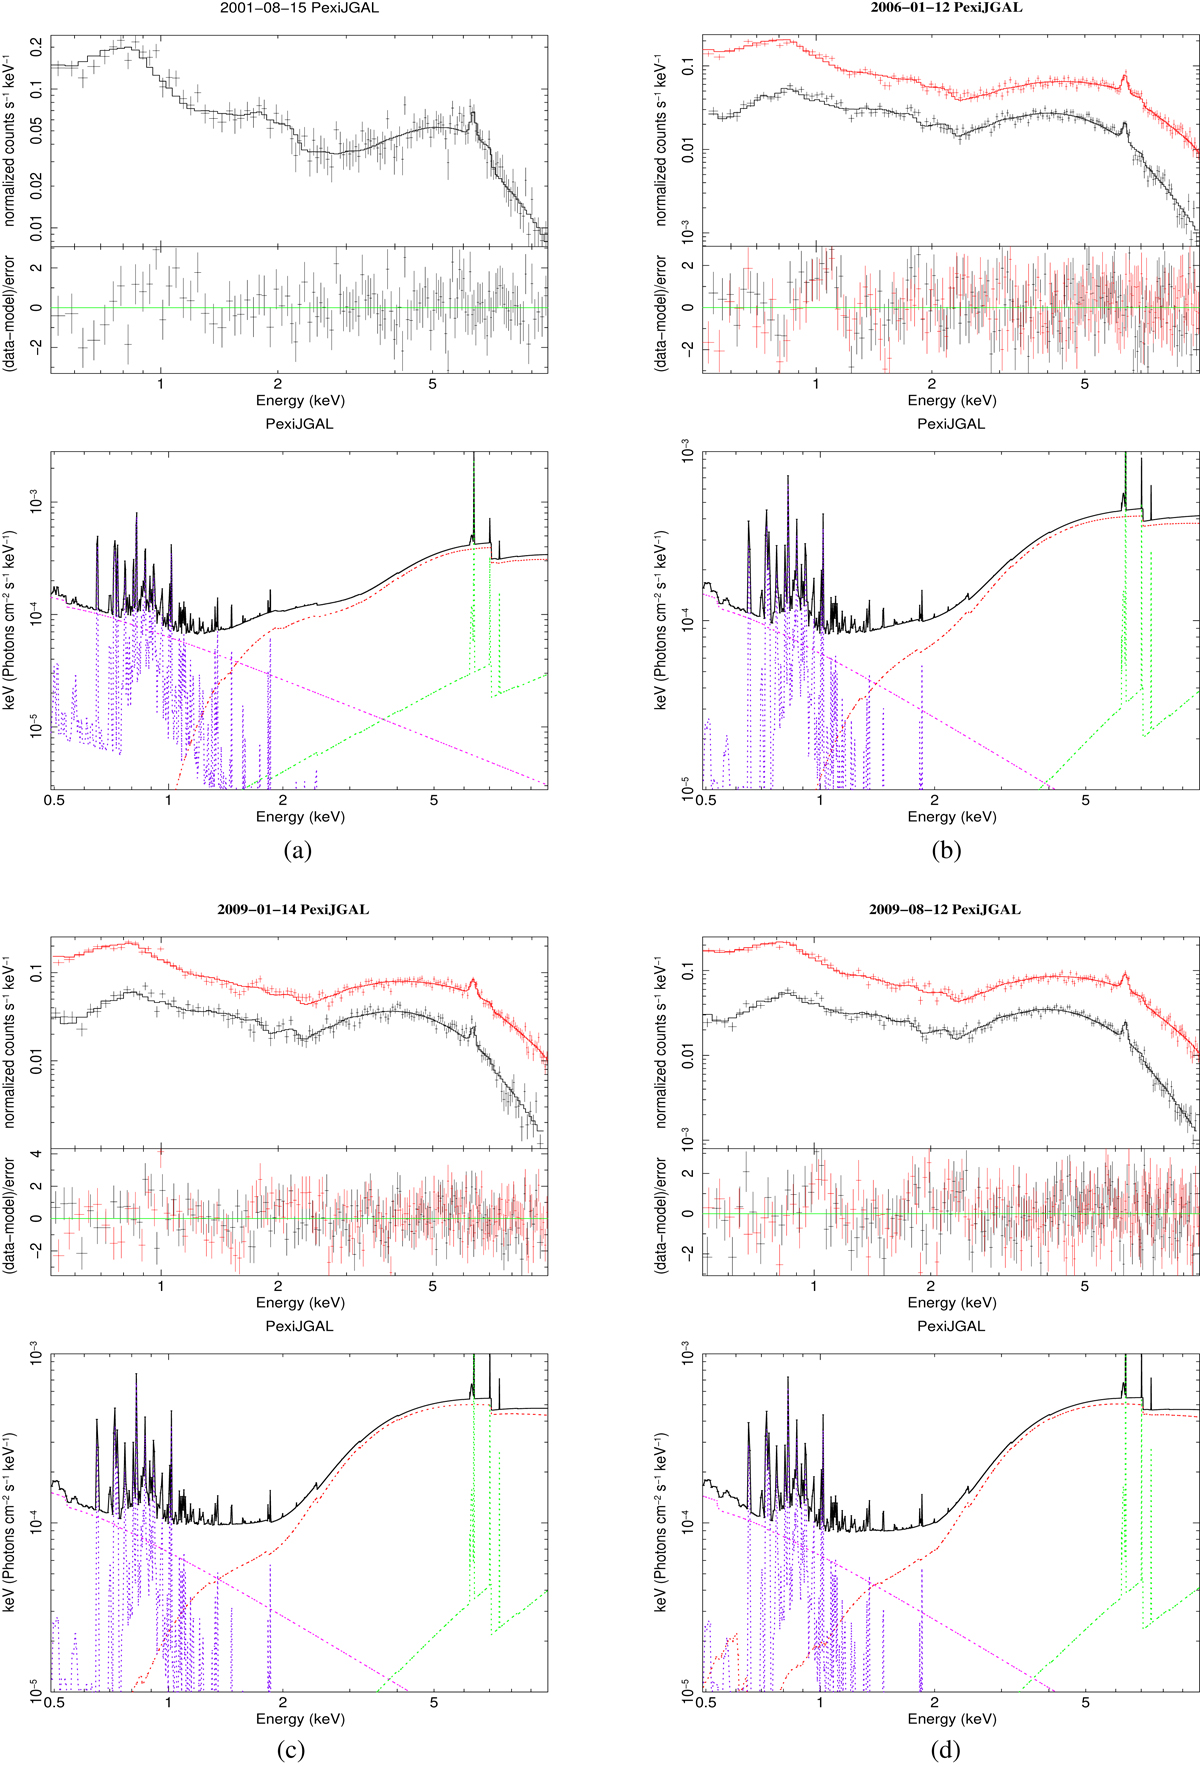
XMM-Newton spectra fitted with the PexiJGAL model (black line), together with the fit residuals and the individual model components. The red line is the absorbed power law from the nucleus and the green line is the pexmon model. The blue and magenta lines are the jet plus galaxy model. (a) Spectrum of 2001 August 15, (b) spectrum of 2006 January 12, (c) spectrum of 2009 January 14, and (d) spectrum of 2009 August 12.
Current usage metrics show cumulative count of Article Views (full-text article views including HTML views, PDF and ePub downloads, according to the available data) and Abstracts Views on Vision4Press platform.
Data correspond to usage on the plateform after 2015. The current usage metrics is available 48-96 hours after online publication and is updated daily on week days.
Initial download of the metrics may take a while.