Fig. 1.
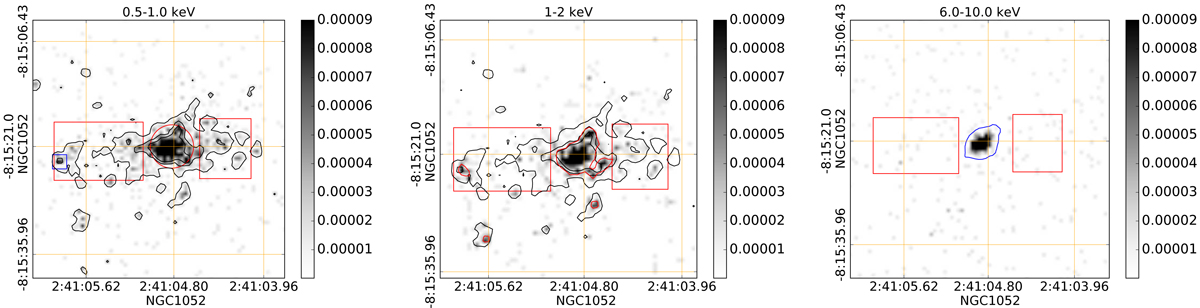
Chandra images of NGC 1052 (units of cts s−1) covering the central 22″ × 27″ region (∼2.4 × 2.9 kpc). The orange grid shows units of 11.1″ × 13.3″, where 11.1″ corresponds to 1.2 kpc at z = 0.005. Left: image in the 0.5−1 keV energy range together with black contours corresponding to flux levels at 5, 20, and 35σ above the background. The red circle shows the outer radius of the spectral extraction region for the nucleus and the red rectangles show the spectral extraction regions used for the extended emission from the jet and galaxy. A hot spot associated with the eastern radio lobe is highlighted with a blue rectangle (the radio lobe can be seen in Fig. 2). Centre: image in the 1−2 keV energy range together with a red contour corresponding to 5σ. The contours for the 0.5–1 keV image in the left panel are also shown for reference. Right: image in the 6−10 keV energy band. The blue contour shows the 5σ level from the 2−6 keV image.
Current usage metrics show cumulative count of Article Views (full-text article views including HTML views, PDF and ePub downloads, according to the available data) and Abstracts Views on Vision4Press platform.
Data correspond to usage on the plateform after 2015. The current usage metrics is available 48-96 hours after online publication and is updated daily on week days.
Initial download of the metrics may take a while.