Free Access
Fig. 8.
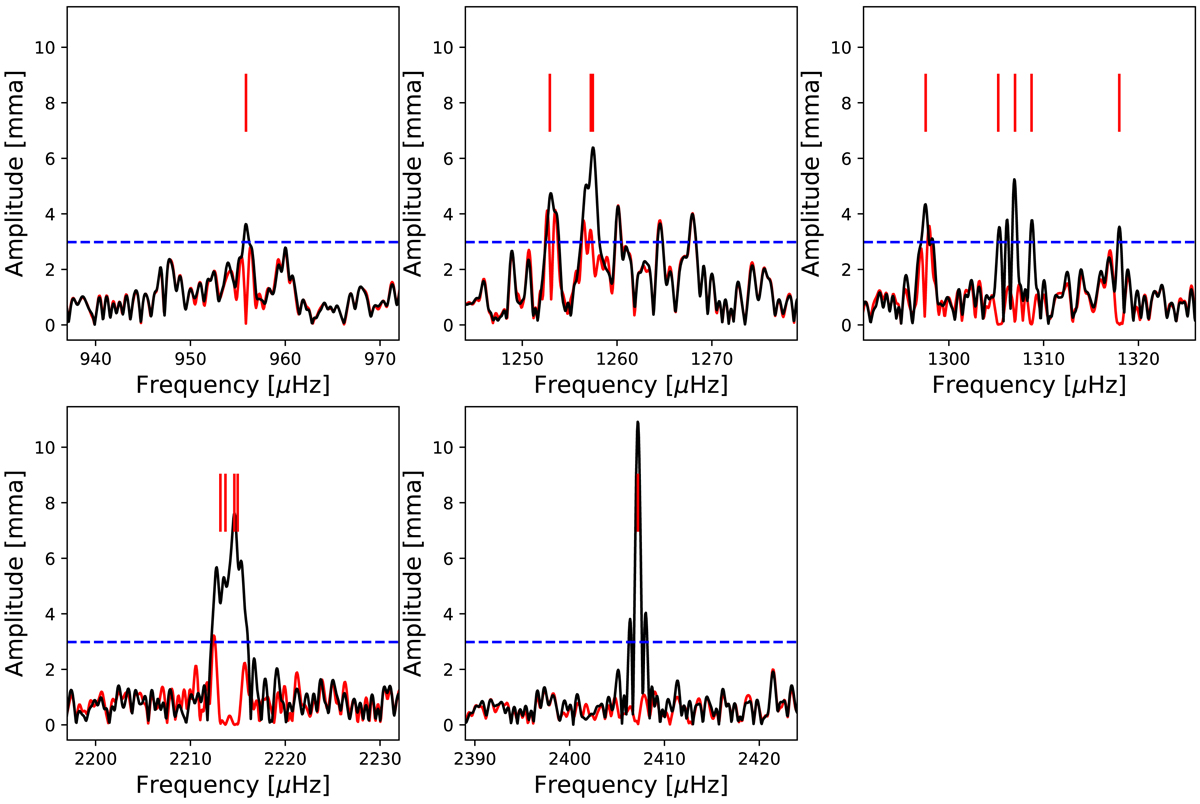
Fourier transform of TESS light curve of MCT 0145−2211; the blue dashed line indicates the 0.1% FAP level (S/N = 4.57). Red bars mark the frequencies obtained by a successive least-squares fitting and pre-whitening process. Residuals after pre-whitening are shown as the red curve.
Current usage metrics show cumulative count of Article Views (full-text article views including HTML views, PDF and ePub downloads, according to the available data) and Abstracts Views on Vision4Press platform.
Data correspond to usage on the plateform after 2015. The current usage metrics is available 48-96 hours after online publication and is updated daily on week days.
Initial download of the metrics may take a while.