Free Access
Fig. 5.
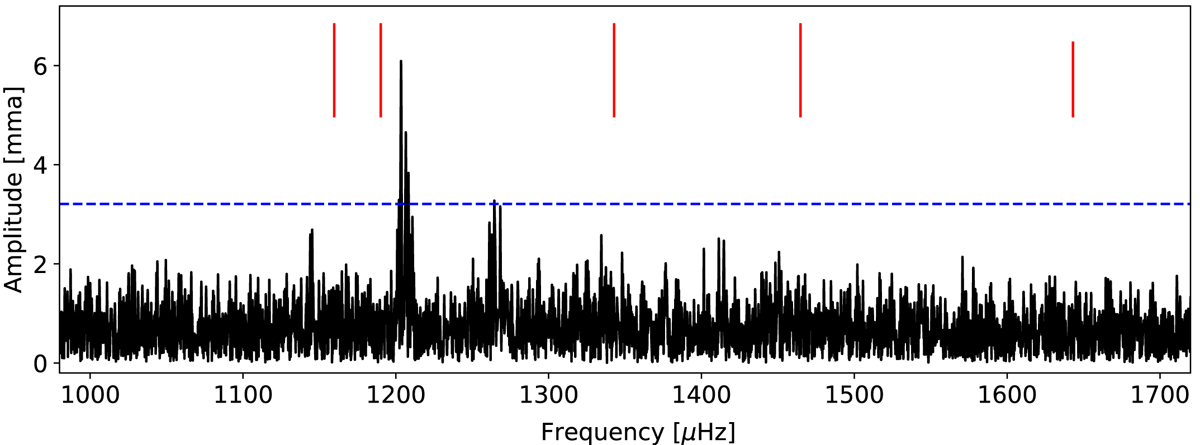
Fourier transform of light curve of BPM 30551 in the only spectral region where signals reached above the 0.1% FAP level (S/N = 4.69, blue dashed line). Red lines mark the approximate frequencies seen in the 1975 data reported in Hesser et al. (1976) and listed in Table 7.
Current usage metrics show cumulative count of Article Views (full-text article views including HTML views, PDF and ePub downloads, according to the available data) and Abstracts Views on Vision4Press platform.
Data correspond to usage on the plateform after 2015. The current usage metrics is available 48-96 hours after online publication and is updated daily on week days.
Initial download of the metrics may take a while.