Free Access
Fig. 16.
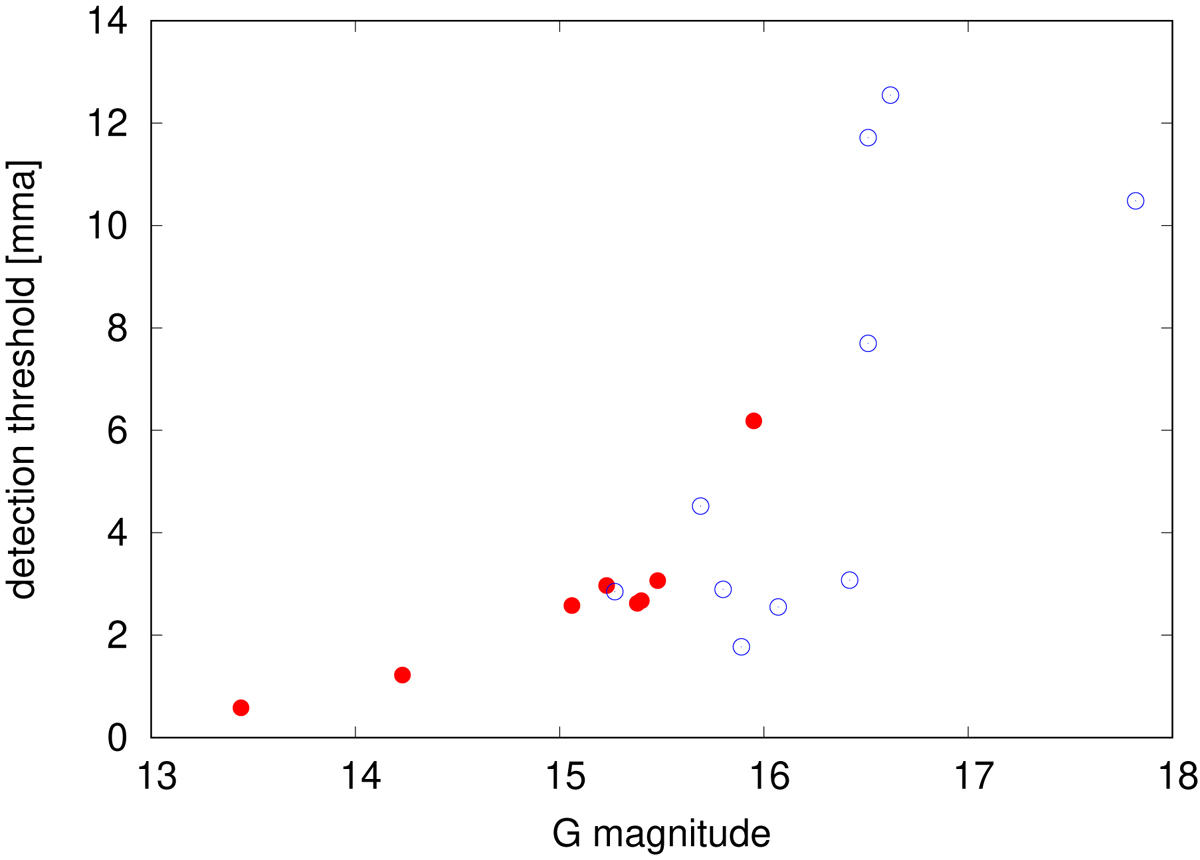
Pulsation-detection performance of TESS. Stars confirmed (red dots) or not seen to vary (blue circles) by the TESS observations in the G magnitude-detection threshold diagram, where the detection threshold is defined as ![]() .
.
Current usage metrics show cumulative count of Article Views (full-text article views including HTML views, PDF and ePub downloads, according to the available data) and Abstracts Views on Vision4Press platform.
Data correspond to usage on the plateform after 2015. The current usage metrics is available 48-96 hours after online publication and is updated daily on week days.
Initial download of the metrics may take a while.