Free Access
Fig. 14.
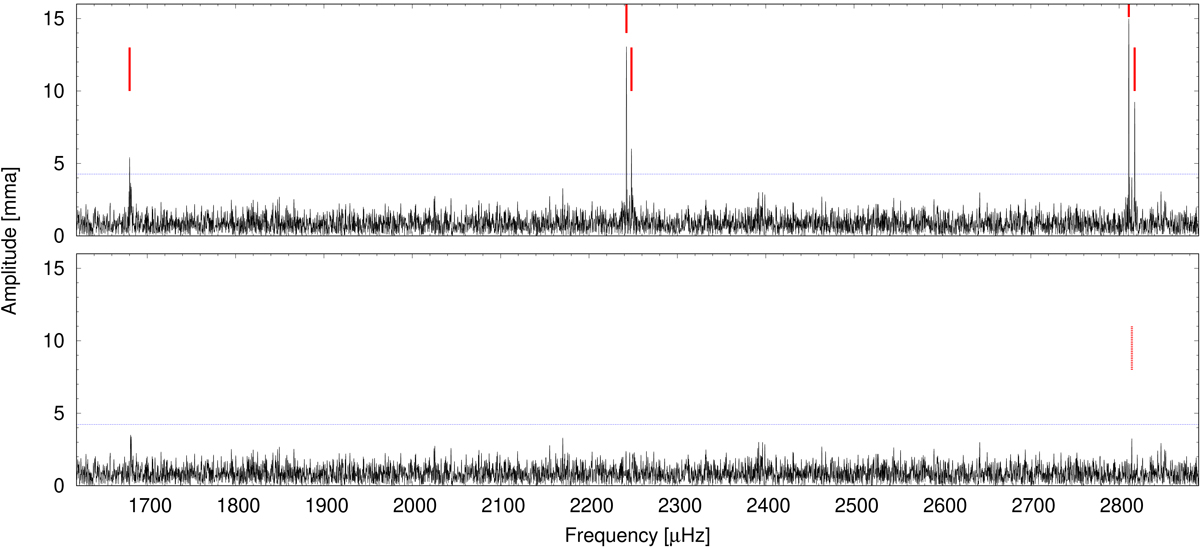
Fourier transform of light curve of HS 0507+0434B before (upper panel) and after (lower panel) pre-whitening with the five significant frequencies. Red dashed lines mark the frequencies listed in Table 11, while the blue dashed lines represent the 0.1% FAP levels (S/N = 4.73).
Current usage metrics show cumulative count of Article Views (full-text article views including HTML views, PDF and ePub downloads, according to the available data) and Abstracts Views on Vision4Press platform.
Data correspond to usage on the plateform after 2015. The current usage metrics is available 48-96 hours after online publication and is updated daily on week days.
Initial download of the metrics may take a while.