Fig. 10.
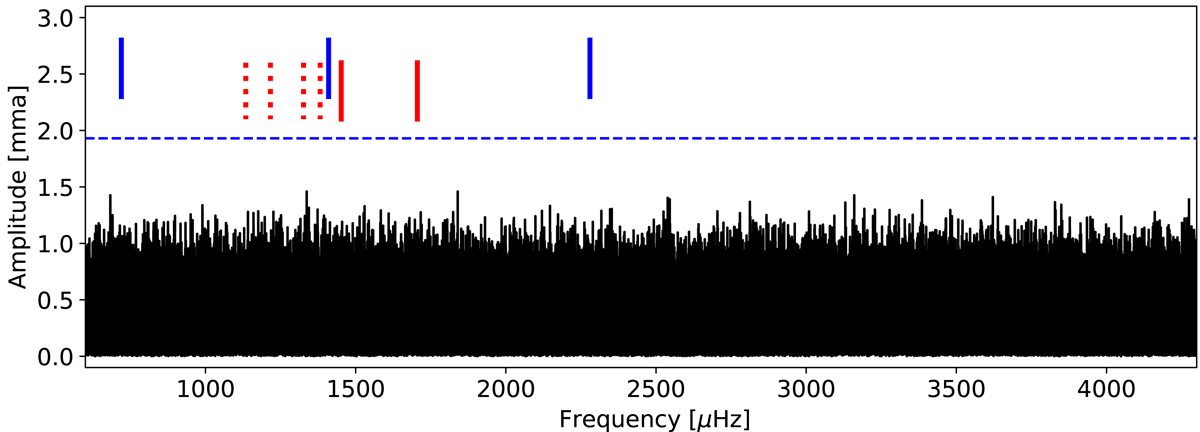
Fourier transform of Sectors 1–13 of TESS light curve of HE 0532−5605; the blue dashed line indicates the 0.1% FAP level (S/N = 5.24). Vertical red lines mark the frequencies from Fontaine et al. (2003), dashed lines are additional frequencies from that data reported by Castanheira & Kepler (2009), and blue vertical lines (offset upwards) mark those from Kilkenny et al. (2014).
Current usage metrics show cumulative count of Article Views (full-text article views including HTML views, PDF and ePub downloads, according to the available data) and Abstracts Views on Vision4Press platform.
Data correspond to usage on the plateform after 2015. The current usage metrics is available 48-96 hours after online publication and is updated daily on week days.
Initial download of the metrics may take a while.