Fig. 1.
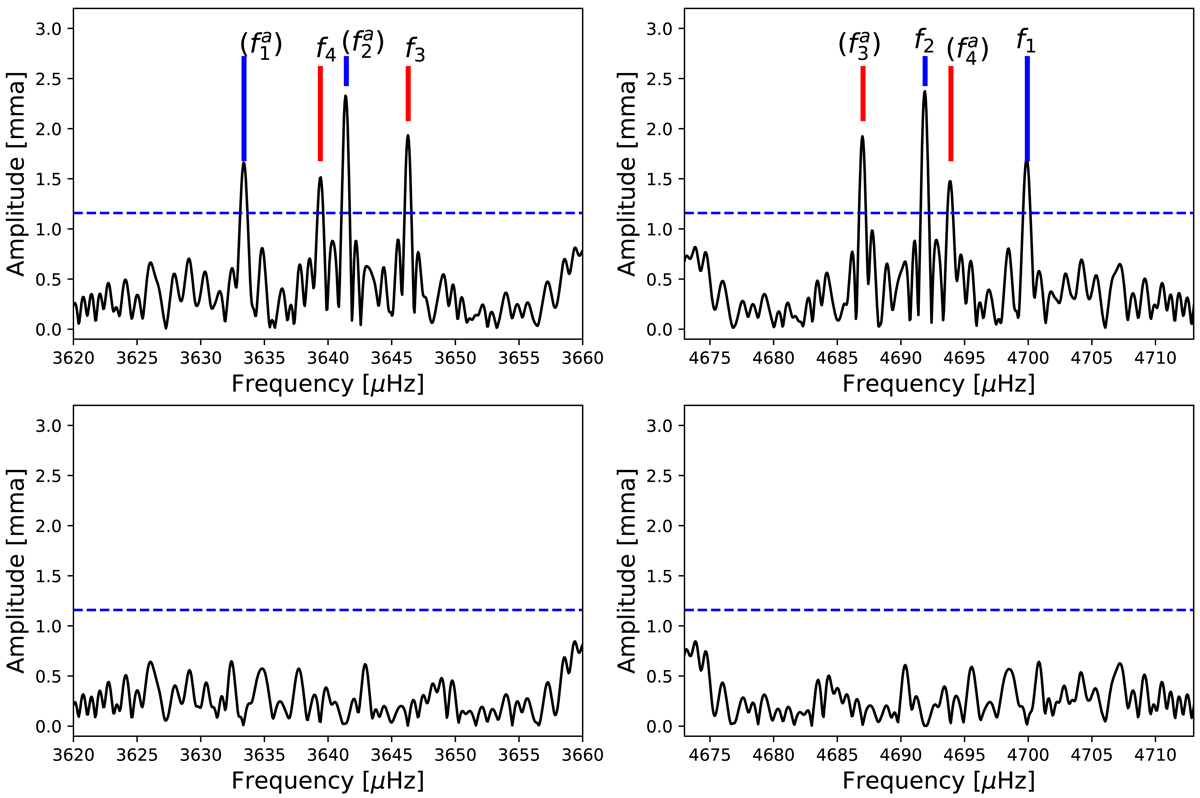
Fourier transform of TESS light curve of Ross 548. Left panels: sub-Nyquist frequency range where the signal exceeds the 0.1% FAP (S/N = 4.54, horizontal dashed line). The peaks correspond to f3 and f4 from Table 3 (red lines), and the aliases (reflected across the Nyquist frequency) of f1 and f2 (blue vertical lines). Right-hand panels: transform above the Nyquist frequency, where the real periodicity – alias situation is reversed. Two bottom panels: residuals in the spectrum after pre-whitening by the least-squares fit sinusoids f1, f2, f3, f4 listed in Table 4.
Current usage metrics show cumulative count of Article Views (full-text article views including HTML views, PDF and ePub downloads, according to the available data) and Abstracts Views on Vision4Press platform.
Data correspond to usage on the plateform after 2015. The current usage metrics is available 48-96 hours after online publication and is updated daily on week days.
Initial download of the metrics may take a while.