Free Access
Fig. 3.
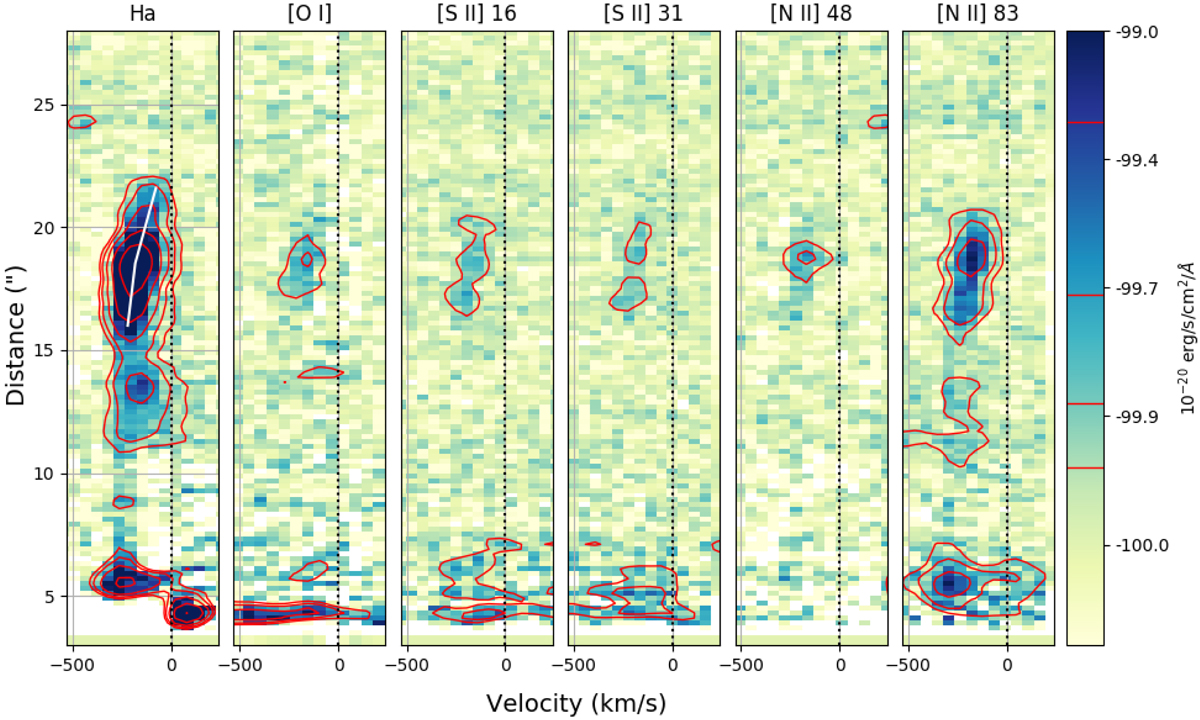
Position-velocity diagrams of the main jet emission lines. From left to right: Hα, [O I] λ6300, [S II] λ6716, [S II] λ6731, [N II] λ6548, and [N II] λ6583. The white line in the Hα panel indicates the peak velocity.
Current usage metrics show cumulative count of Article Views (full-text article views including HTML views, PDF and ePub downloads, according to the available data) and Abstracts Views on Vision4Press platform.
Data correspond to usage on the plateform after 2015. The current usage metrics is available 48-96 hours after online publication and is updated daily on week days.
Initial download of the metrics may take a while.