Fig. 7
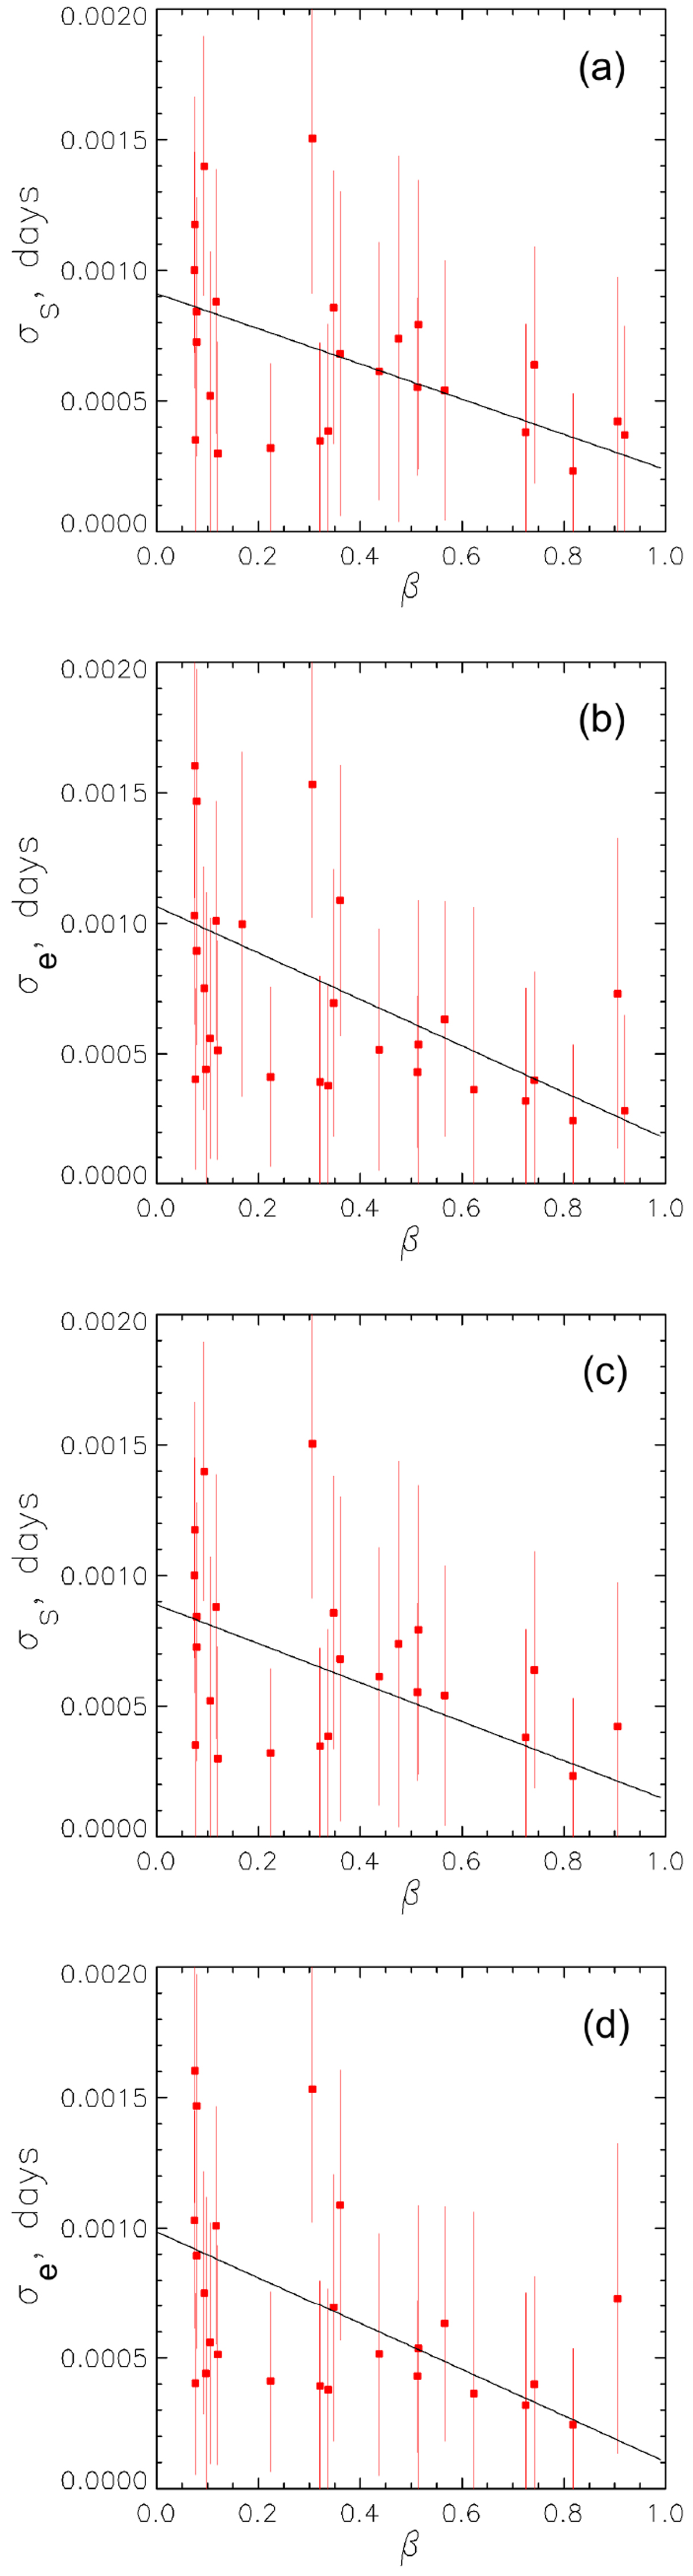
Deviation, σs,e, of transit borders’ timing, versus β estimates, confirming the negative derivative ∂σs,e∕∂β in Eq. (7) for the ingress (panel a) and egress (panel b) parts of the TLC. Only objects with rse < 0, β > 0.07, and border timing errors εs,e < 0.0007 days from Table A.1 were included. The solid lines show the corresponding regressions. Panels c and d are the same as panels a and b, but for the confirmed planets with status “p” only, irrespective of extensions (“!”, “*”, “?”).
Current usage metrics show cumulative count of Article Views (full-text article views including HTML views, PDF and ePub downloads, according to the available data) and Abstracts Views on Vision4Press platform.
Data correspond to usage on the plateform after 2015. The current usage metrics is available 48-96 hours after online publication and is updated daily on week days.
Initial download of the metrics may take a while.