Fig. 2
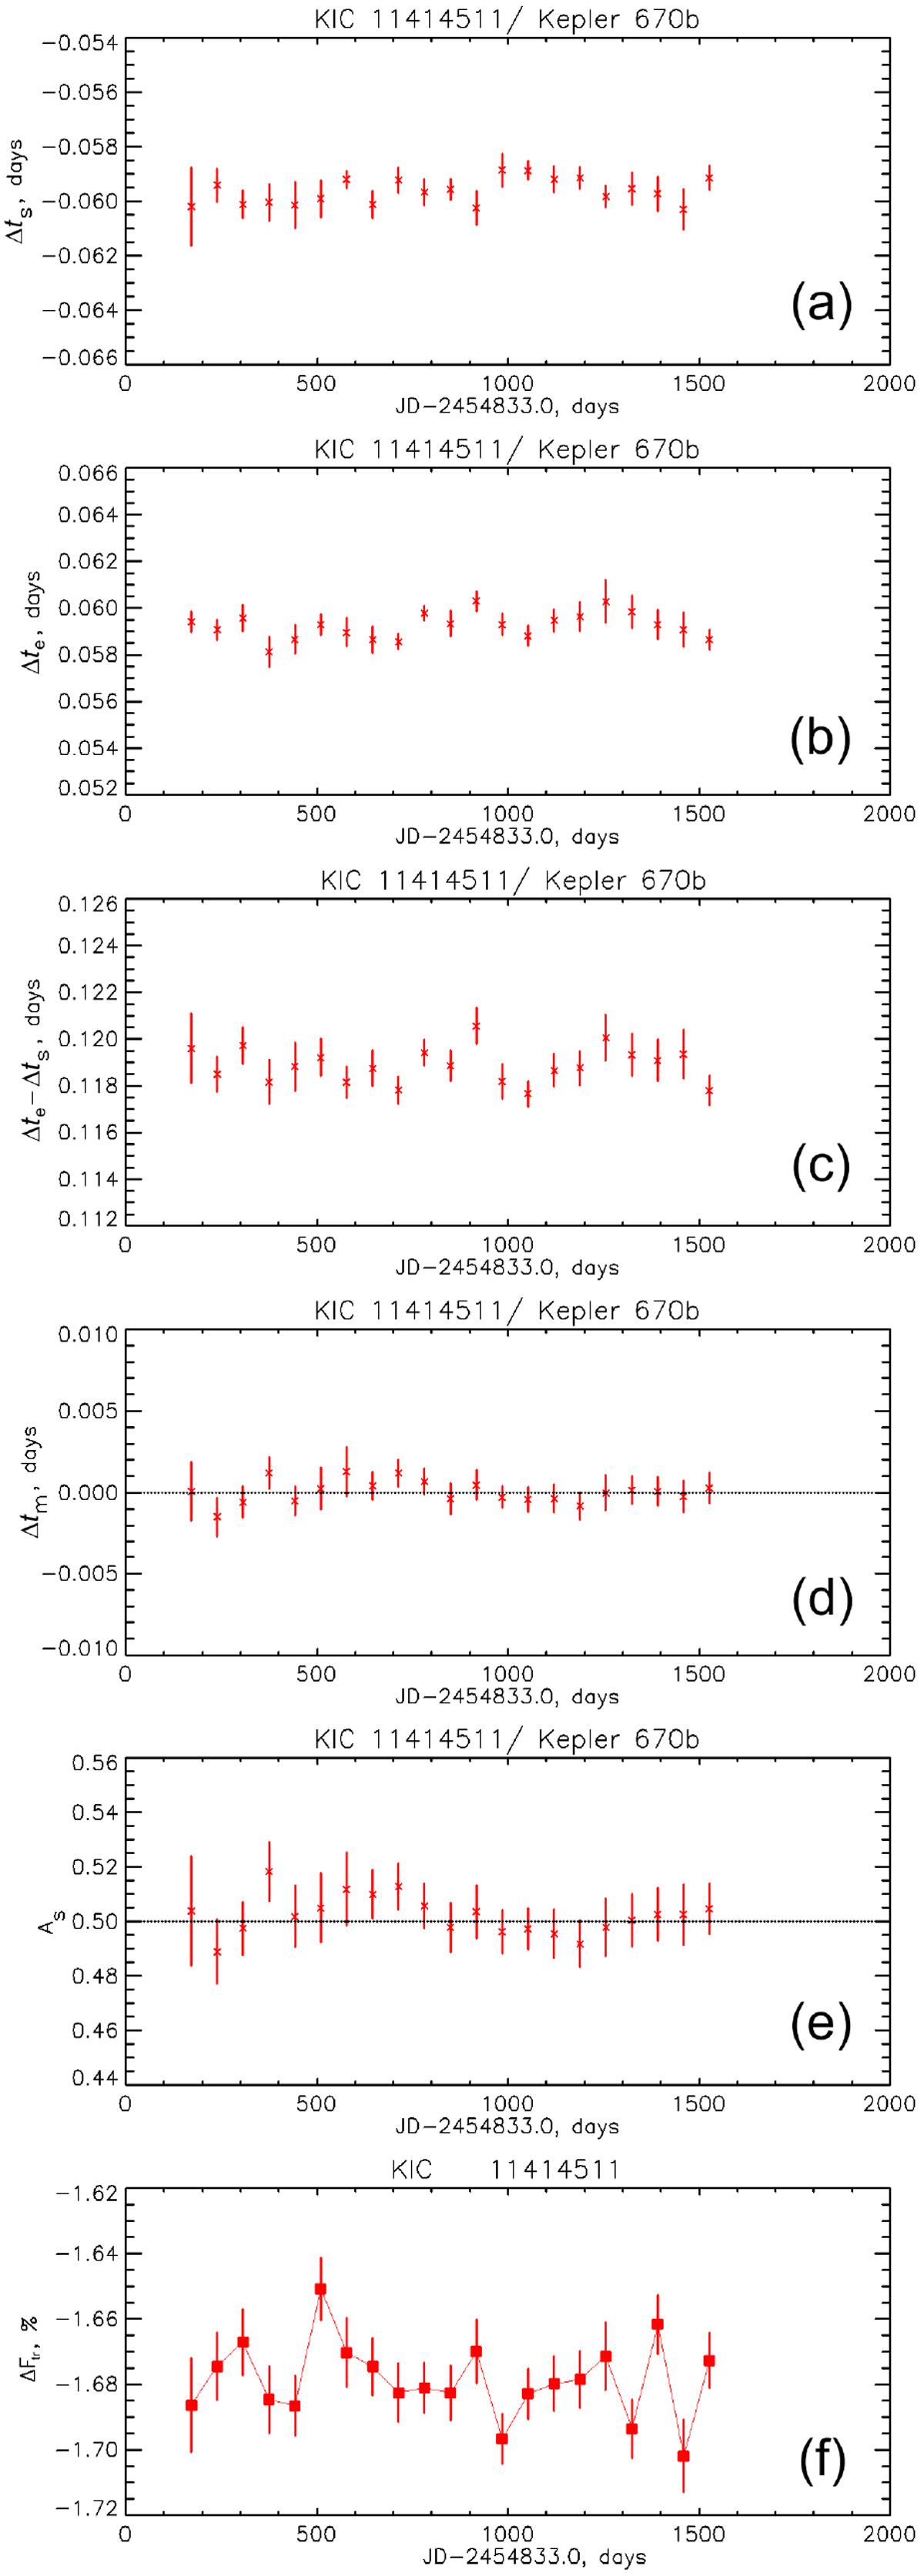
Temporal behavior of the transit timing parameters of real TLCs like in Fig. 1b, compiled for a sequence of adjacent time-windows, vs. time in Julian days JD: panel a: transit start-time Δts. Panel b: transit end-time Δte. Panel c: transit duration Δte − Δts. Panel d: transit minimum-time Δtm (maximal flux decrease). Panel e: transit shape parameter As. Panel f: transit flux decrease ΔFtr.
Current usage metrics show cumulative count of Article Views (full-text article views including HTML views, PDF and ePub downloads, according to the available data) and Abstracts Views on Vision4Press platform.
Data correspond to usage on the plateform after 2015. The current usage metrics is available 48-96 hours after online publication and is updated daily on week days.
Initial download of the metrics may take a while.