Free Access
Fig. 17
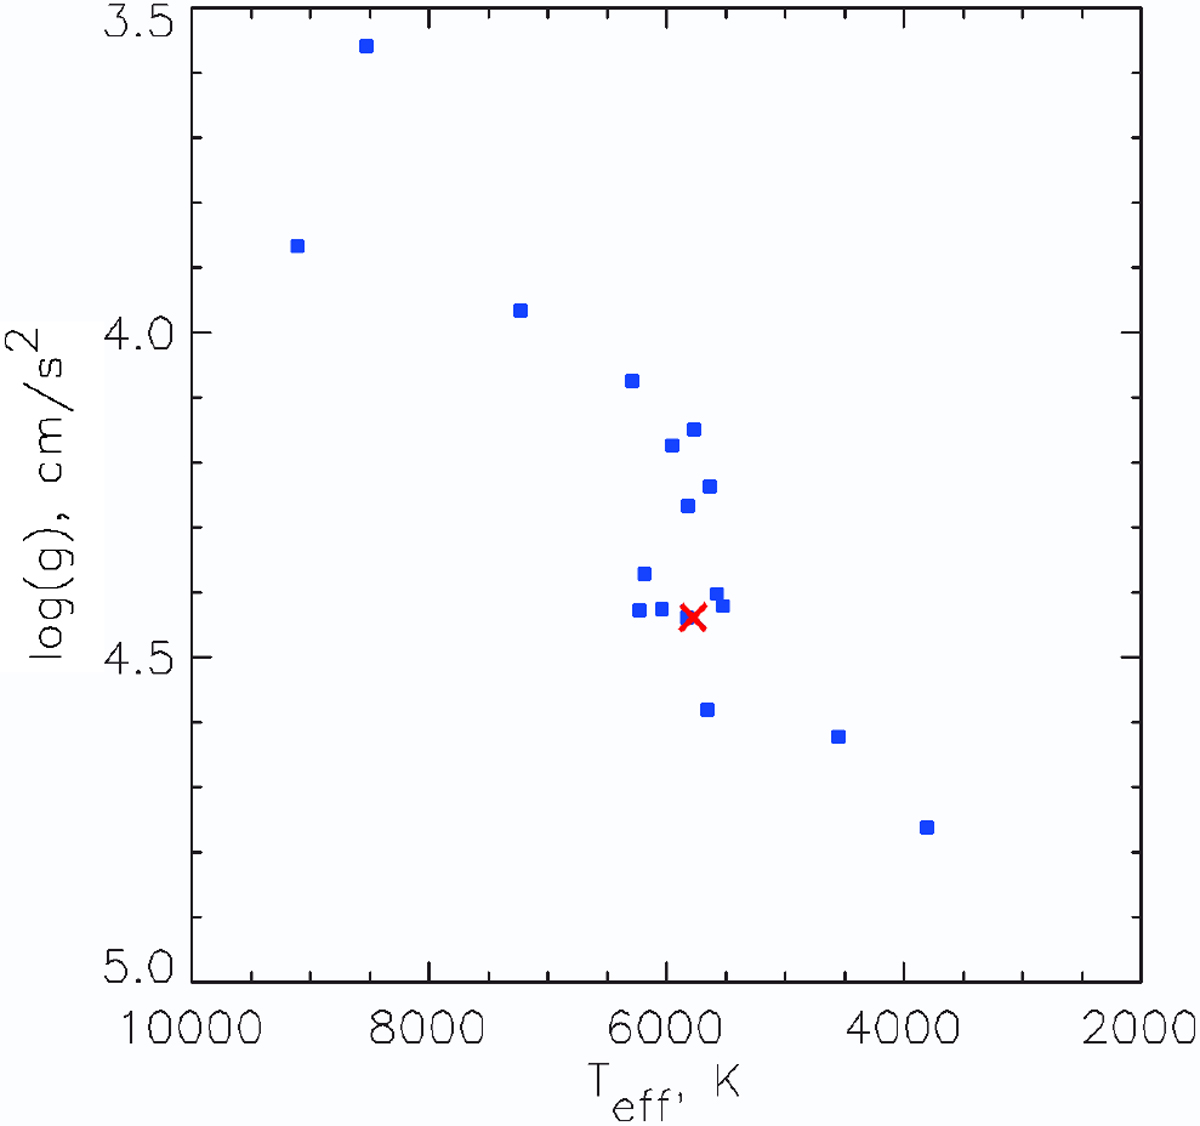
Stellar gravity (log (g)) vs. effective temperature (Teff) distribution of the systems with the noticeably varying transit borders (see Table A.2) according to the NASA EA. The red cross marks the position of the Sun.
Current usage metrics show cumulative count of Article Views (full-text article views including HTML views, PDF and ePub downloads, according to the available data) and Abstracts Views on Vision4Press platform.
Data correspond to usage on the plateform after 2015. The current usage metrics is available 48-96 hours after online publication and is updated daily on week days.
Initial download of the metrics may take a while.