Fig. 11
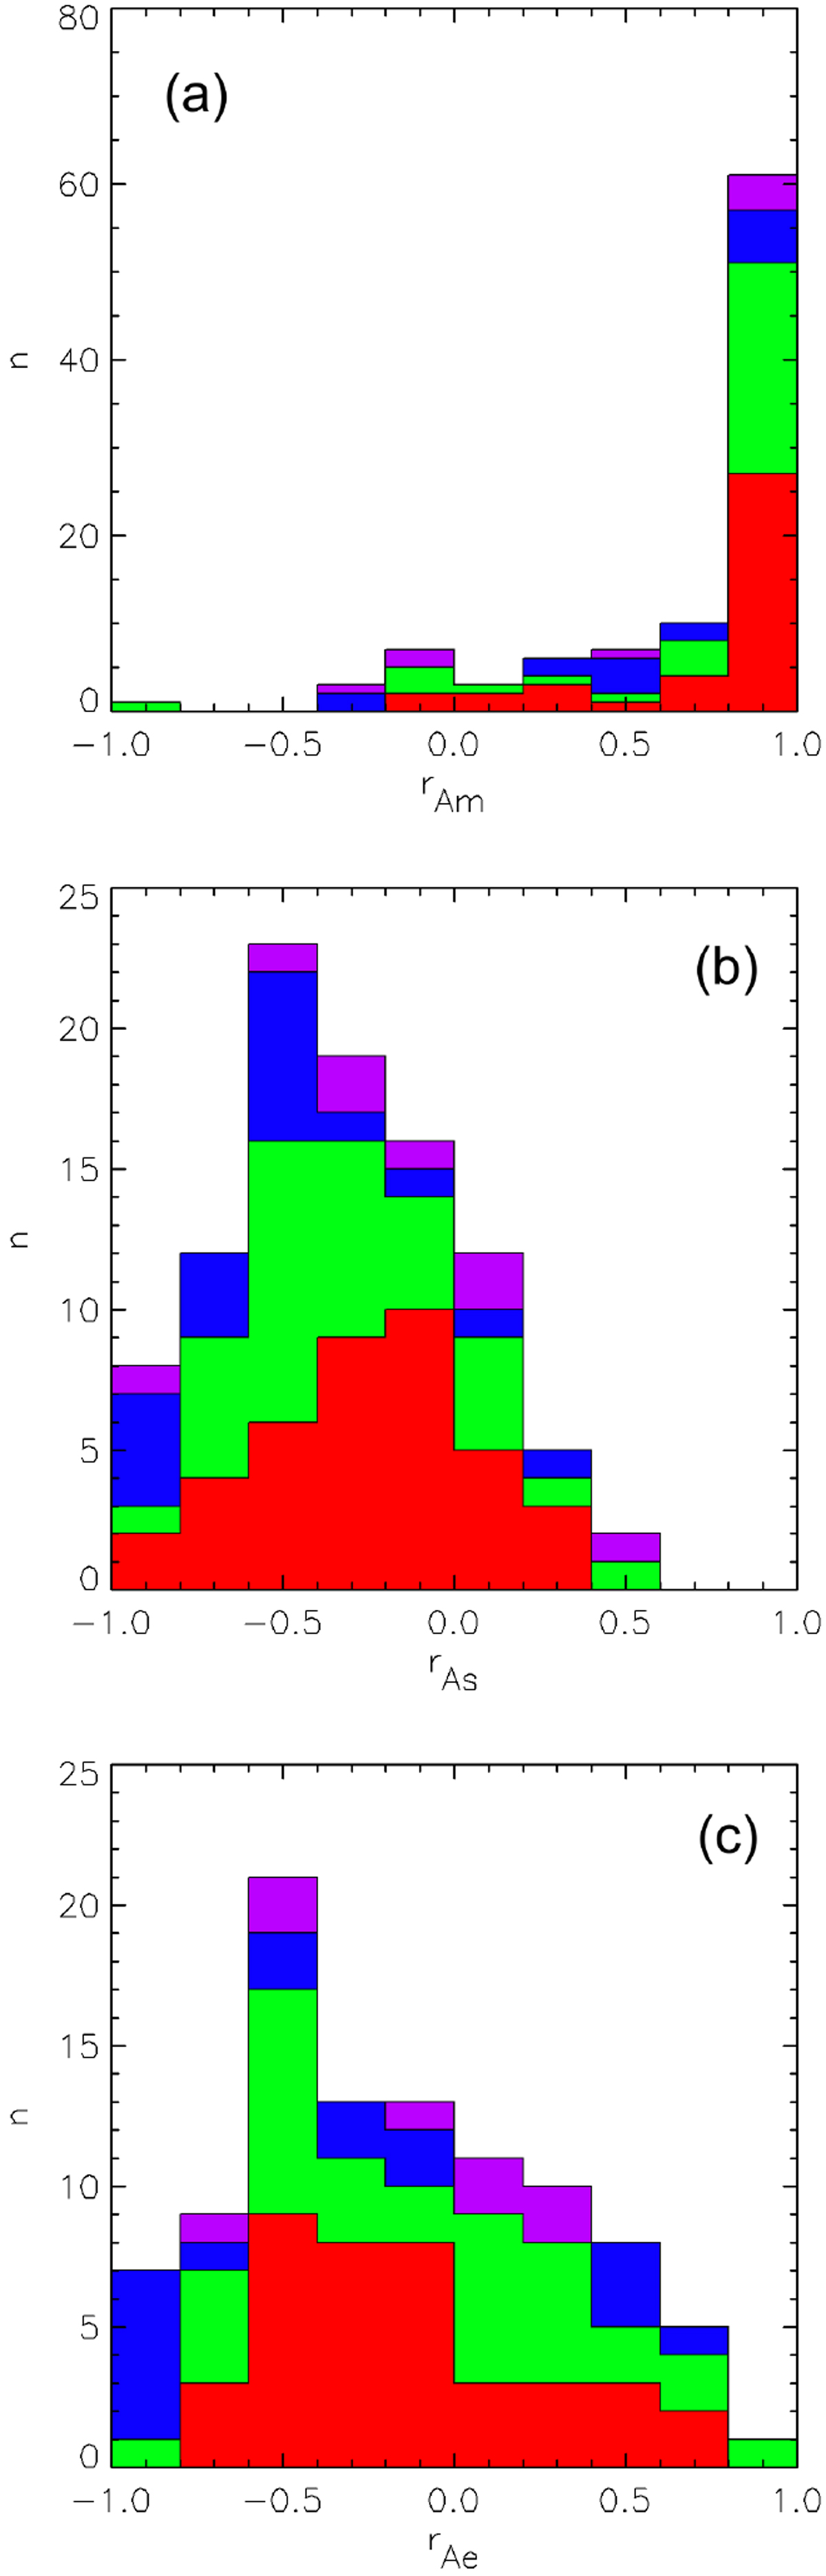
Pearson correlation coefficients between the transit shape parameter As and TLC timing parameters: panel a: distribution histogram of rAm – the correlation between As and Δtm. Panel b: distribution histogram of rAs – the correlation between As and Δts. Panel c: distribution histogram of rAe - the correlation between As and Δte. Color showsthe status of objects within a bin, as in Figs. 3 and 6.
Current usage metrics show cumulative count of Article Views (full-text article views including HTML views, PDF and ePub downloads, according to the available data) and Abstracts Views on Vision4Press platform.
Data correspond to usage on the plateform after 2015. The current usage metrics is available 48-96 hours after online publication and is updated daily on week days.
Initial download of the metrics may take a while.