Fig. 1
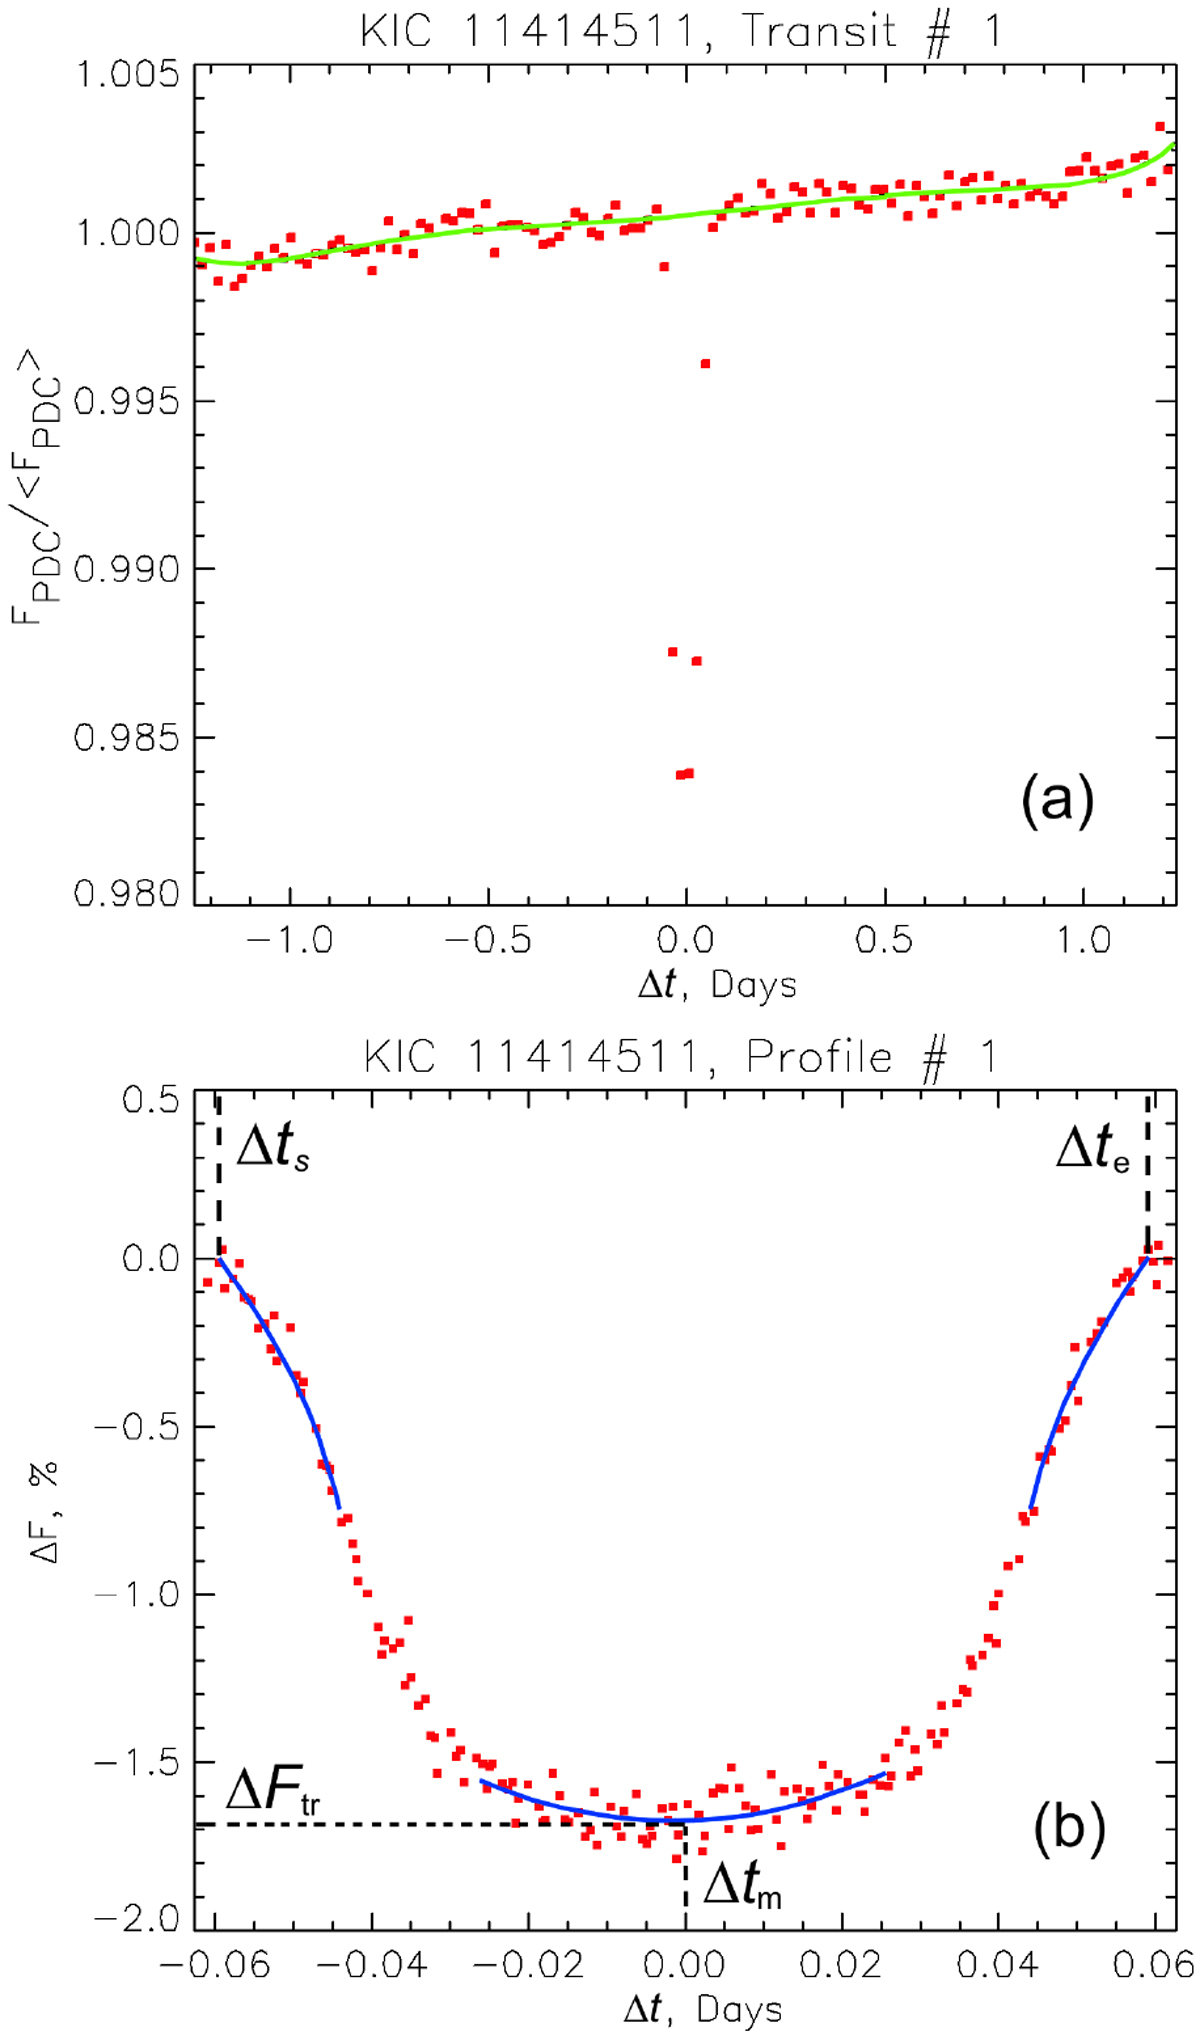
Example of light-curve processing (the star KIC 11414511). Panel a: approximation of the transit background (red squares) with a sixth-order polynomial Fb(t) (green curve). Panel b: folded profile ΔF(Δt) of 25 adjacent individual transits. Blue curves are the applied polynomial approximations used for measurements of labeled parameters.
Current usage metrics show cumulative count of Article Views (full-text article views including HTML views, PDF and ePub downloads, according to the available data) and Abstracts Views on Vision4Press platform.
Data correspond to usage on the plateform after 2015. The current usage metrics is available 48-96 hours after online publication and is updated daily on week days.
Initial download of the metrics may take a while.