Fig. 8.
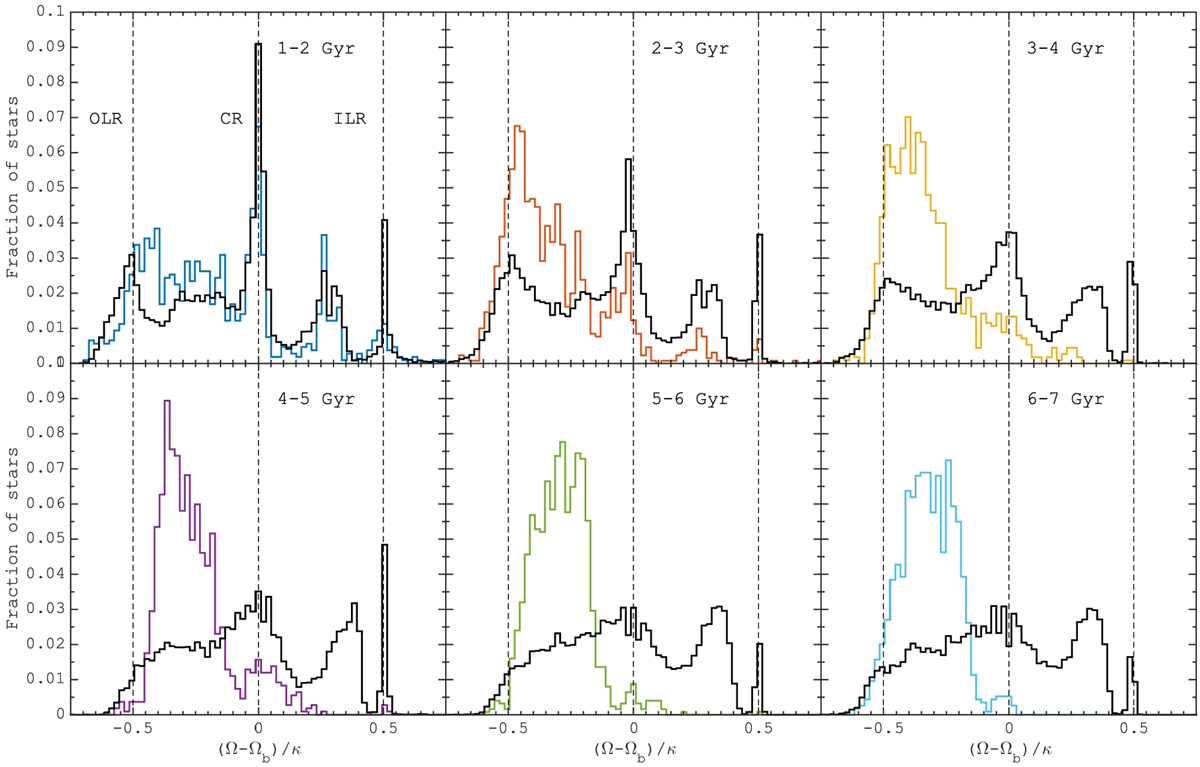
Frequency ratio of orbits of migrated stars with ε < 0.5 at 7 Gyr shown by the colored lines for different periods. For the same time intervals the frequency ratios for 200 000 randomly selected particles in the whole disk are shown by the black lines. Both distributions were normalized to the total number of stars in each sample separately. The vertical dashed lines indicate three main resonances of the bar: the ILR, the CR, and the OLR (from left to right). Diminishing of the bar strength over time is depicted in the decrease in a number of stars associated with its main resonances. Migrated low-ε stars almost escaped the resonances at the end of the simulation.
Current usage metrics show cumulative count of Article Views (full-text article views including HTML views, PDF and ePub downloads, according to the available data) and Abstracts Views on Vision4Press platform.
Data correspond to usage on the plateform after 2015. The current usage metrics is available 48-96 hours after online publication and is updated daily on week days.
Initial download of the metrics may take a while.