Fig. 5.
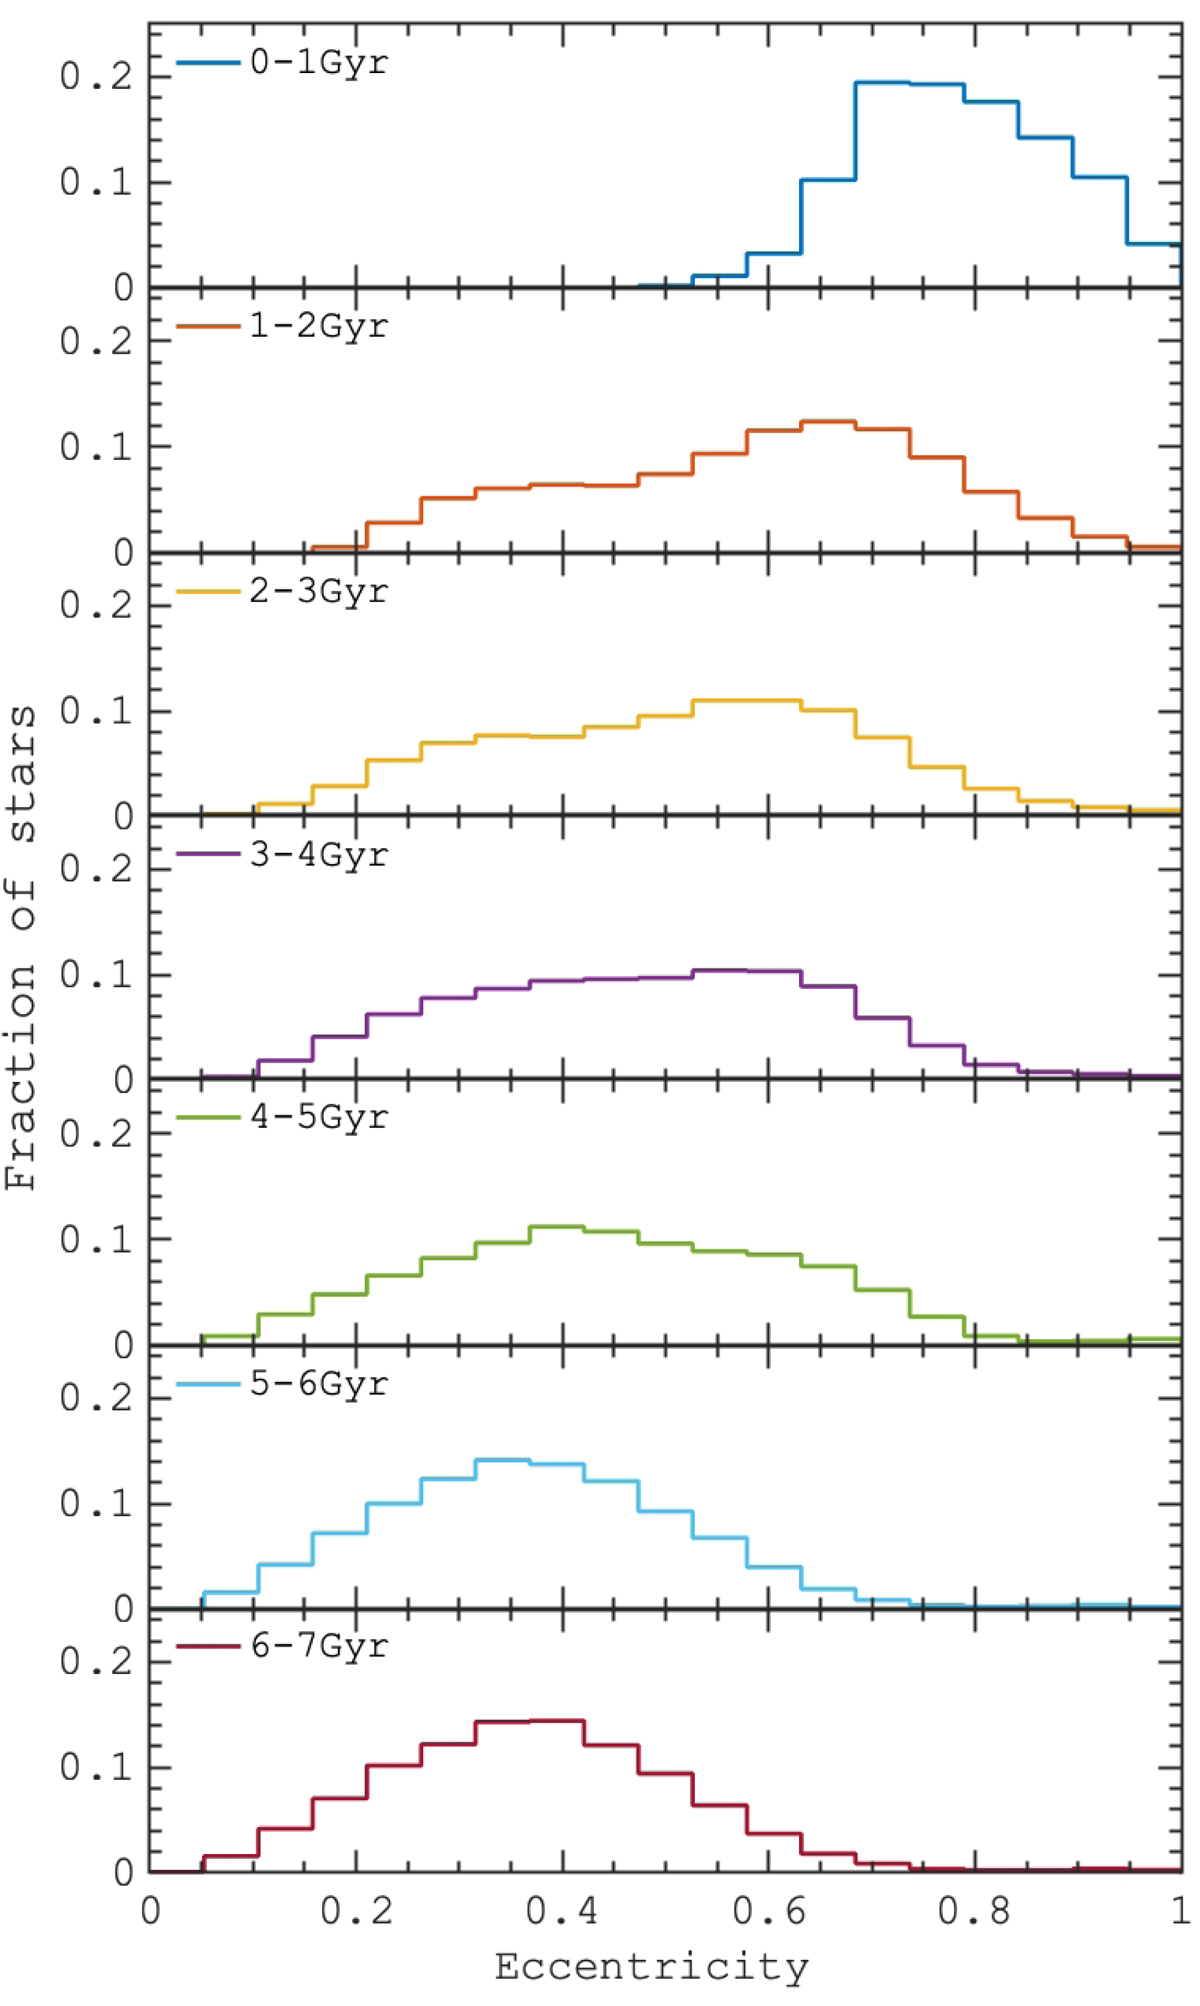
Distribution of orbital eccentricities (see Eq. (1)) of migrating stars selected in the red box in Fig. 2. The eccentricities are calculated by using apocenters and pericenters of stellar orbits measured in different 1 Gyr time intervals, as mentioned in each frame. The mean value of eccentricity tends to decrease in time, and low-eccentricity stars start to appear after 3 Gyr.
Current usage metrics show cumulative count of Article Views (full-text article views including HTML views, PDF and ePub downloads, according to the available data) and Abstracts Views on Vision4Press platform.
Data correspond to usage on the plateform after 2015. The current usage metrics is available 48-96 hours after online publication and is updated daily on week days.
Initial download of the metrics may take a while.