Fig. 2.
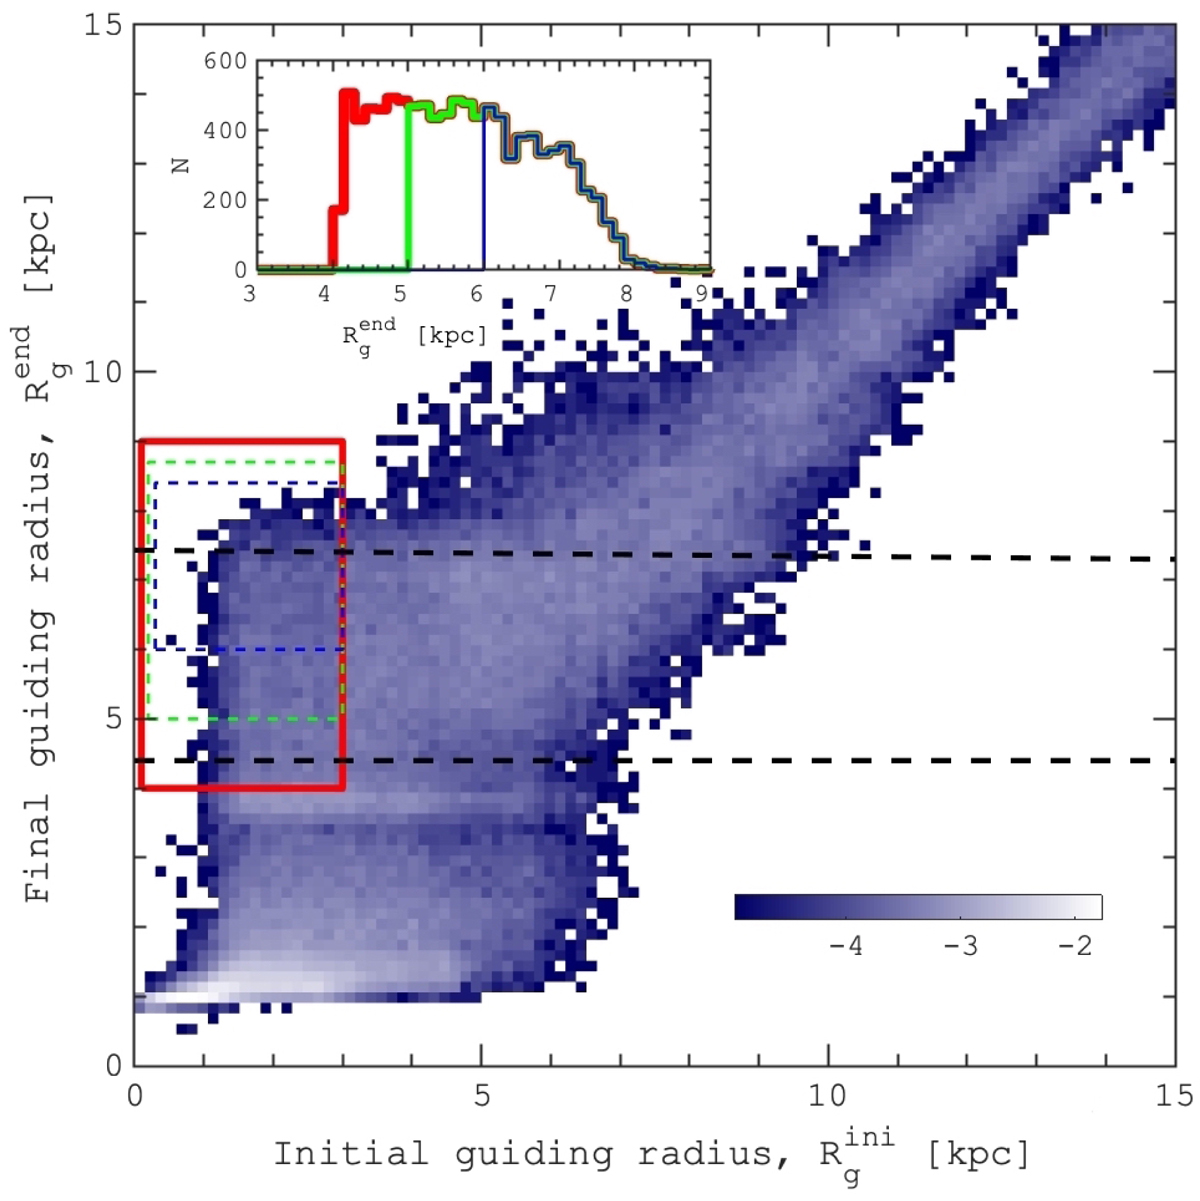
Relation between the initial value (![]() , the mean value at T < 250 Myr) and the final value (
, the mean value at T < 250 Myr) and the final value (![]() , mean value at 6 < T < 7 Gyr) of guiding radius for thin-disk stars. The color-coding indicates the fraction of stars in log-scale. Horizontal overdensity feature at
, mean value at 6 < T < 7 Gyr) of guiding radius for thin-disk stars. The color-coding indicates the fraction of stars in log-scale. Horizontal overdensity feature at ![]() kpc is associated with the corotation radius of the bar at the end of the simulation. Horizontal dashed lines show the mean location of the OLR and CR resonances of the bar (from top to bottom, respectively) averaged over the last Gyr of evolution. The red box contains stars that migrate mostly from the inner region (
kpc is associated with the corotation radius of the bar at the end of the simulation. Horizontal dashed lines show the mean location of the OLR and CR resonances of the bar (from top to bottom, respectively) averaged over the last Gyr of evolution. The red box contains stars that migrate mostly from the inner region (![]() kpc), while the green and blue boxes correspond to the selection weighted toward larger final guiding radii. The inset shows the distribution of guiding radii of all the stars in the red, green, and blue boxes at the end of simulation (
kpc), while the green and blue boxes correspond to the selection weighted toward larger final guiding radii. The inset shows the distribution of guiding radii of all the stars in the red, green, and blue boxes at the end of simulation (![]() ). The statistical properties (mass, distribution of orbital parameters) of the inner disk migrators are dependent on the exact selection of a red region in the diagram.
). The statistical properties (mass, distribution of orbital parameters) of the inner disk migrators are dependent on the exact selection of a red region in the diagram.
Current usage metrics show cumulative count of Article Views (full-text article views including HTML views, PDF and ePub downloads, according to the available data) and Abstracts Views on Vision4Press platform.
Data correspond to usage on the plateform after 2015. The current usage metrics is available 48-96 hours after online publication and is updated daily on week days.
Initial download of the metrics may take a while.