Fig. 6
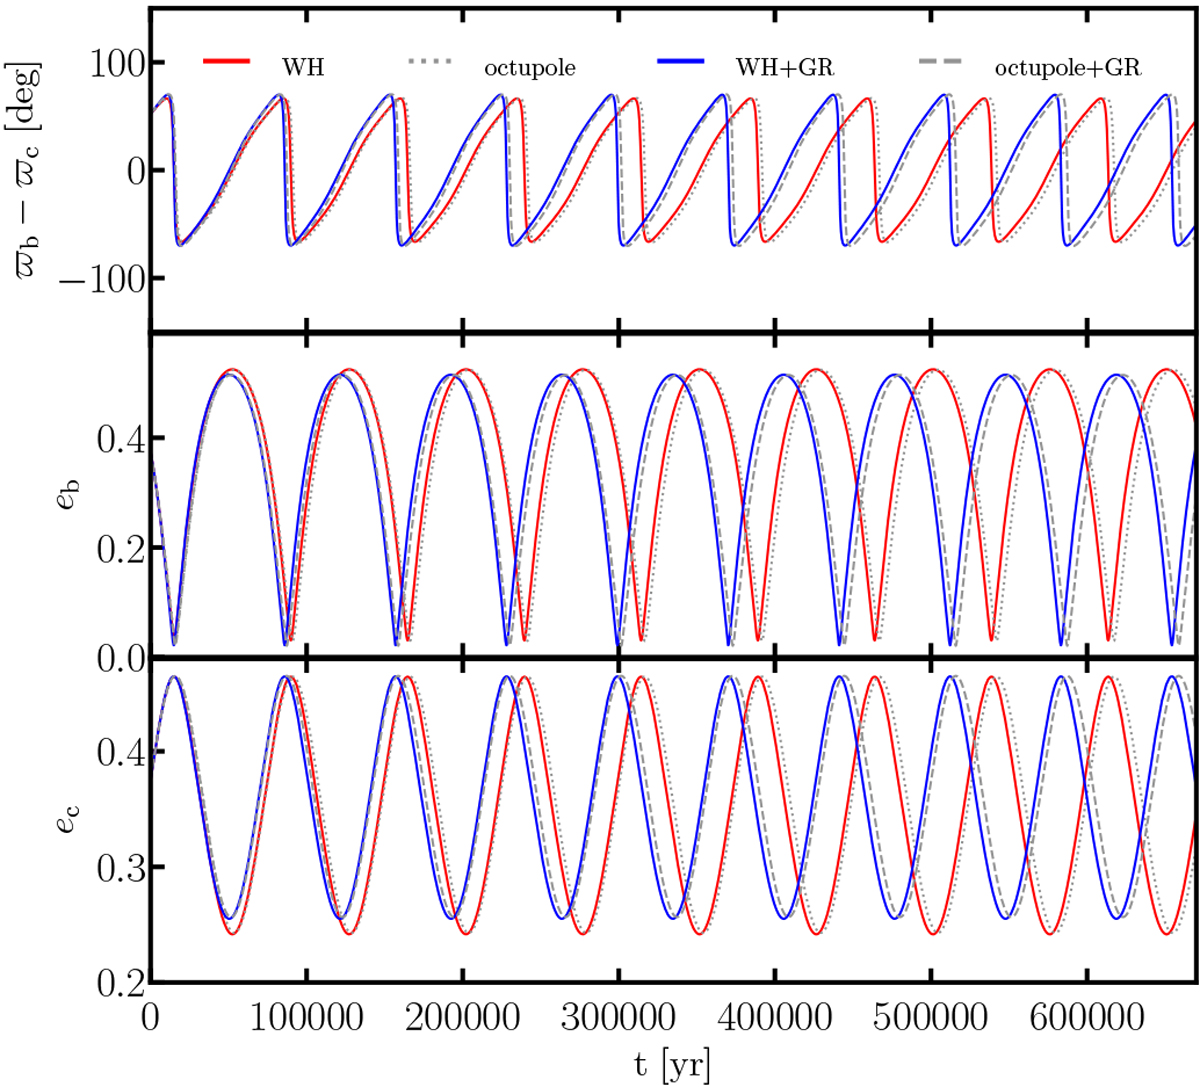
Evolution of the orbital eccentricities eb and ec and apsidal alignment angle Δϖ = ϖb - ϖc. Red curves represent the evolution obtained from the Wisdom-Holman N-body integration evolution of the best fit (see Fig. 5), while red curves are the Wisdom-Holman N-body integration with GR precession included. Gray dashed and dotted curves represent the evolution of the best fit but derived from the octupole secular perturbation theory and the octupole evolution with a GR precession correction, respectively.
Current usage metrics show cumulative count of Article Views (full-text article views including HTML views, PDF and ePub downloads, according to the available data) and Abstracts Views on Vision4Press platform.
Data correspond to usage on the plateform after 2015. The current usage metrics is available 48-96 hours after online publication and is updated daily on week days.
Initial download of the metrics may take a while.