Fig. A.1
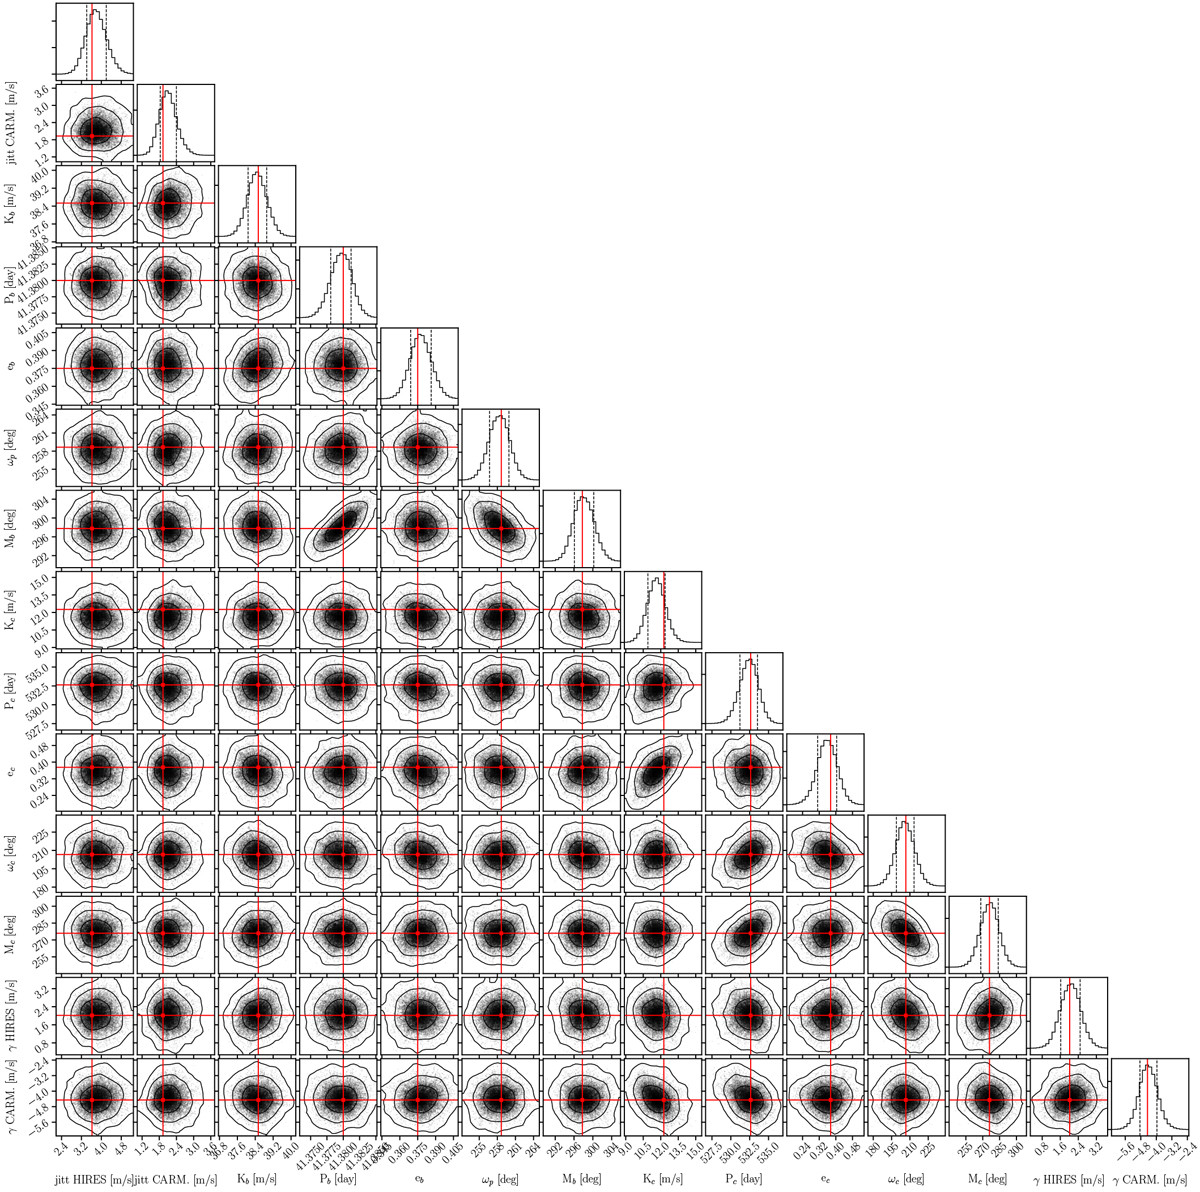
MCMC distribution of orbital parameters consistent with the HIRES and CARMENES RV data of GJ 1148 assuming a coplanar, edge-on, and prograde two-planet system fitted with a self-consistent dynamical model. The position of the best dynamical fit is marked with red grid lines. The black contours on the 2D panels represent the 1, 2, and 3σ confidence level of the overall MCMC samples. The top panels of every column represent the 1D histogram distribution of each parameter. All samples are stable for 10 Myr.
Current usage metrics show cumulative count of Article Views (full-text article views including HTML views, PDF and ePub downloads, according to the available data) and Abstracts Views on Vision4Press platform.
Data correspond to usage on the plateform after 2015. The current usage metrics is available 48-96 hours after online publication and is updated daily on week days.
Initial download of the metrics may take a while.