Fig. 8.
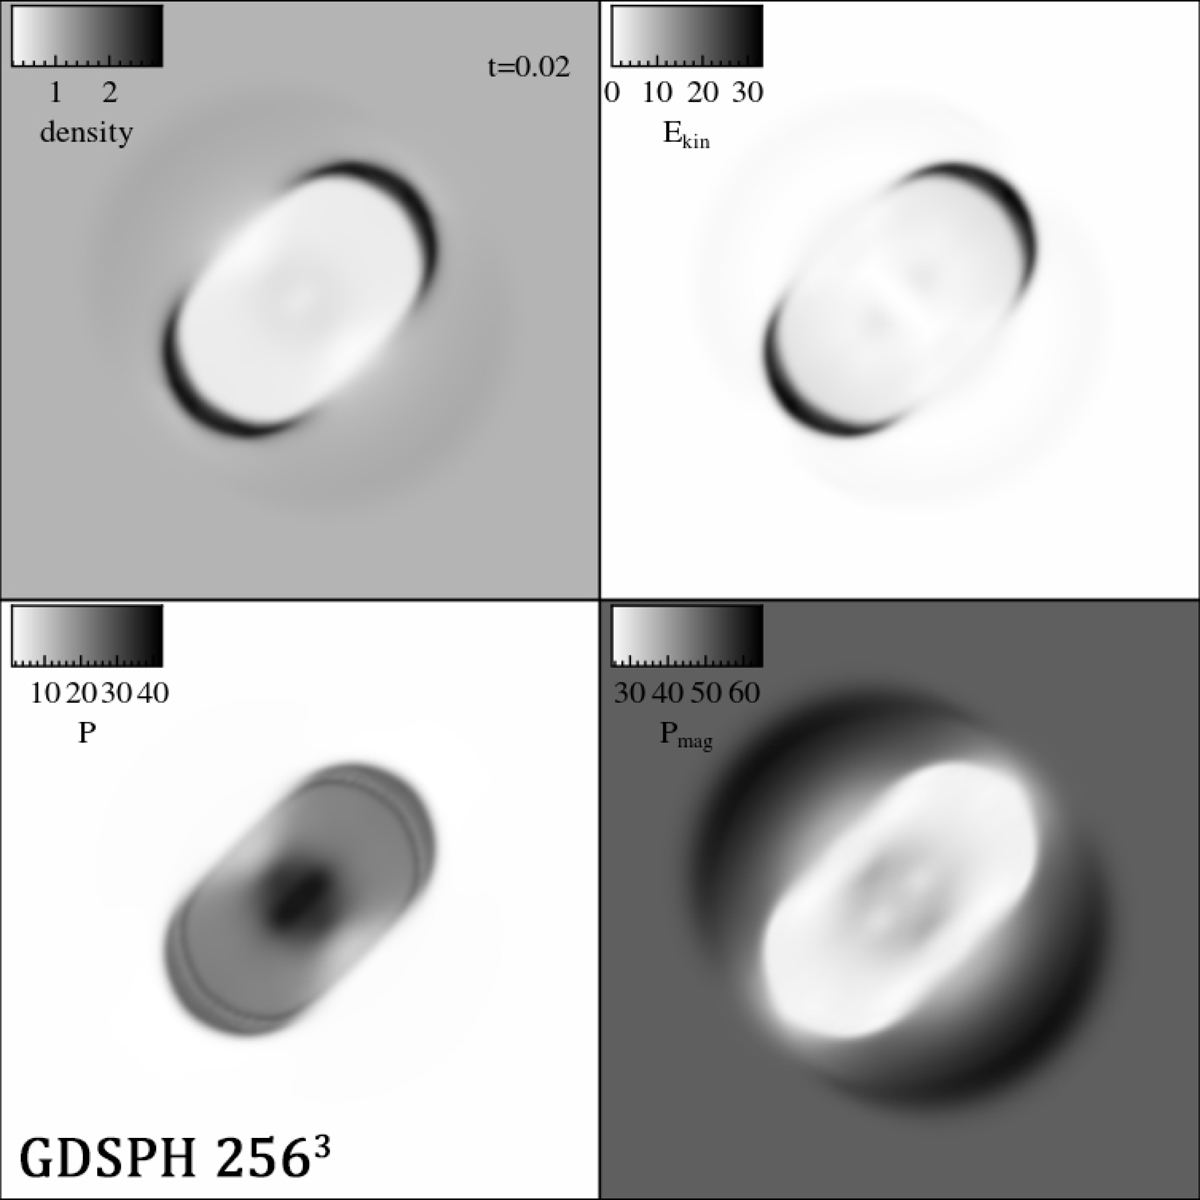
Result from the magnetized blast in 3D in the 2563 GDSPH run, which shows rendered slices of different fluid quantities at t = 0.02. To the top left we can see the density rendering, top right the kinetic energy density, bottom left the thermal pressure and bottom right the magnetic pressure. The limits are taken to be the same as Stone et al. (2008) and Price et al. (2018) for a direct comparison: ρ = [0.19, 2.98], Ekin = [0, 33.1], P = [1, 42.4] and Pmag = [25.2, 65.9].
Current usage metrics show cumulative count of Article Views (full-text article views including HTML views, PDF and ePub downloads, according to the available data) and Abstracts Views on Vision4Press platform.
Data correspond to usage on the plateform after 2015. The current usage metrics is available 48-96 hours after online publication and is updated daily on week days.
Initial download of the metrics may take a while.