Fig. 6.
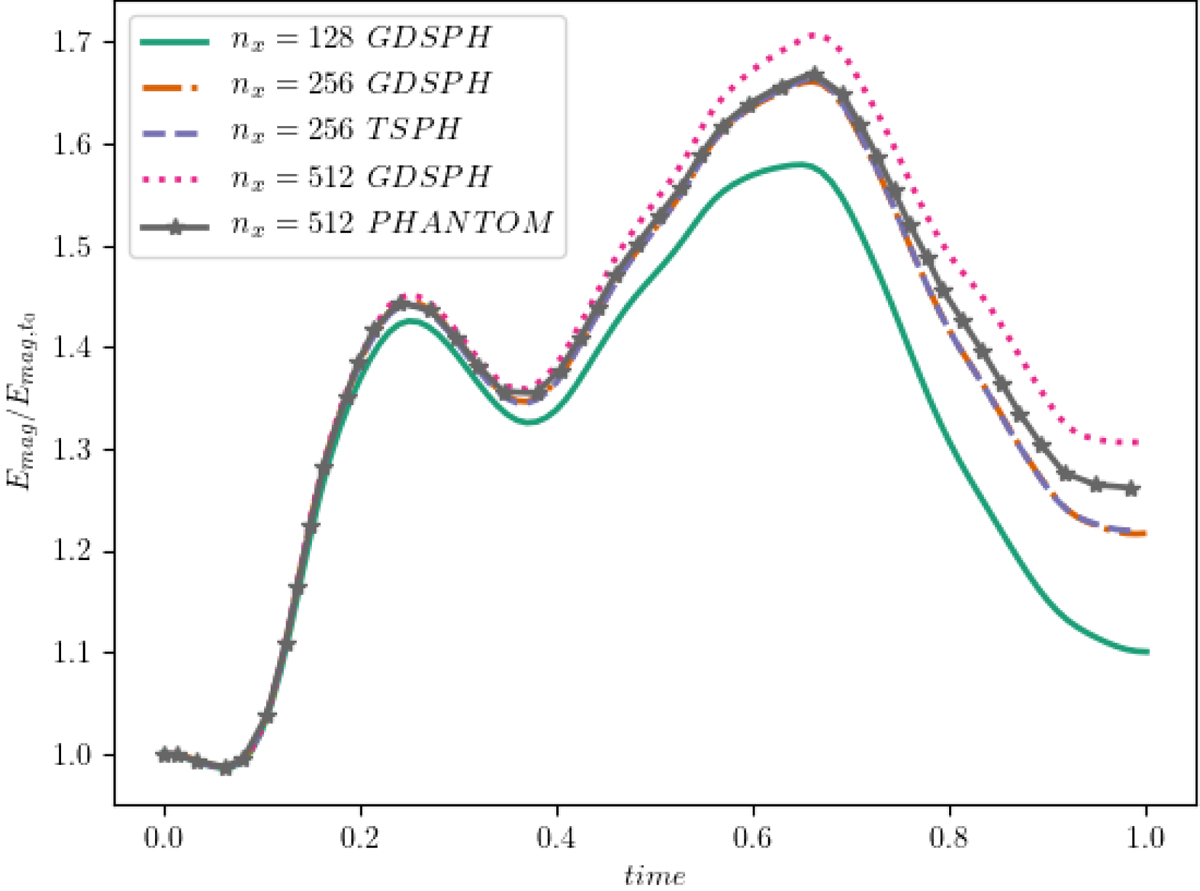
Evolution of the total magnetic energy in units of the initial value for the 3D Orszag-Tang vortex test. We plot the result from three different tested resolutions [nx, ny, nz]=[128, 148, 12],[256, 296, 12],[512, 590, 12] done in GDSPH. We also include a TSPH case with nx = 256 and the nx = 512 curve from Wurster et al. (2017) for comparison sake. We can see that there are no visible difference between the TSPH (purple curve) and GDSPH (brown curve) cases. From the figure, it is also clear that the GDSPH case of nx = 512 (magenta curve) is less dissipative than the simulation from Wurster et al. (2017) (grey curve). Significant differences between resolutions can be seen to occur at later times during the evolution.
Current usage metrics show cumulative count of Article Views (full-text article views including HTML views, PDF and ePub downloads, according to the available data) and Abstracts Views on Vision4Press platform.
Data correspond to usage on the plateform after 2015. The current usage metrics is available 48-96 hours after online publication and is updated daily on week days.
Initial download of the metrics may take a while.