Fig. 4.
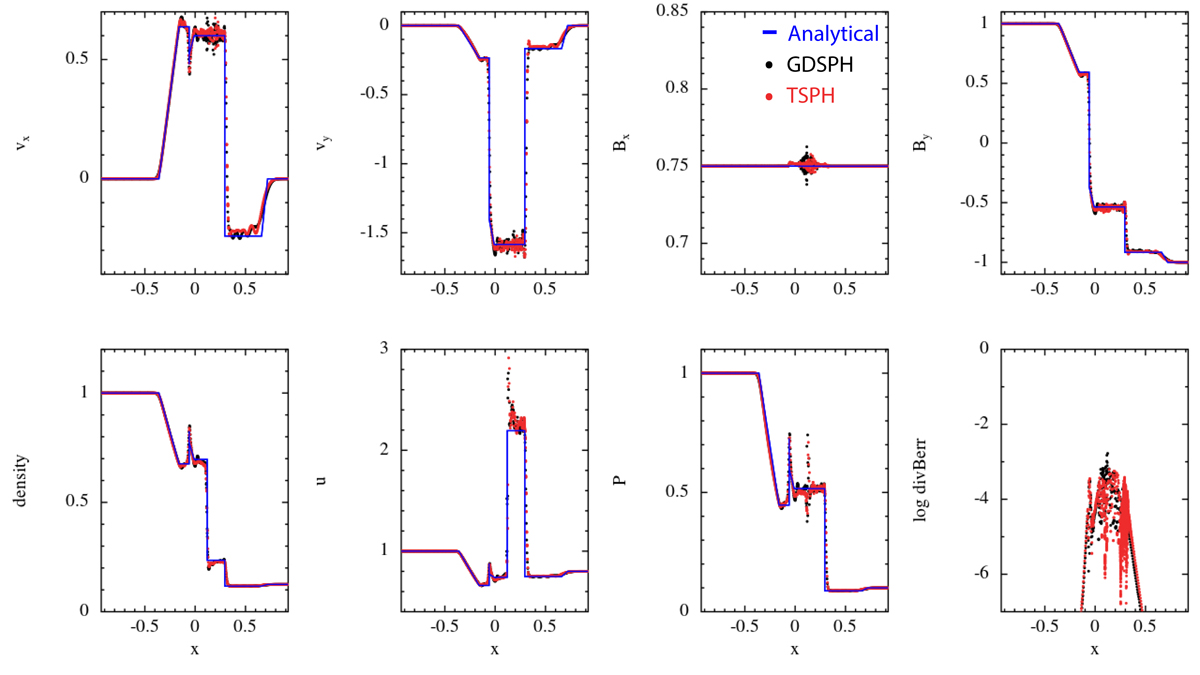
Results from the Brio-Wu shocktube in 3D, with an initial left state (ρL, PL, vx, vy, vz, Bx, By, Bz) = (1, 1, 0, 0, 0, 0.75, 1, 0) and right state (ρR, PR, vx, vy, vz, Bx, By, Bz) = (0.125, 0.1, 0, 0, 0, 0.75, −1, 0). The figure shows the active region of the shock after t = 0.2, which contains about nx ≈ 300−400 particles across the x-direction. The blue line shows the reference solution and the black dots show the result from the GDSPH simulation, while red dots show the result from the TSPH simulation. There are minimal differences between the GDSPH and TSPH result.
Current usage metrics show cumulative count of Article Views (full-text article views including HTML views, PDF and ePub downloads, according to the available data) and Abstracts Views on Vision4Press platform.
Data correspond to usage on the plateform after 2015. The current usage metrics is available 48-96 hours after online publication and is updated daily on week days.
Initial download of the metrics may take a while.