Fig. 16.
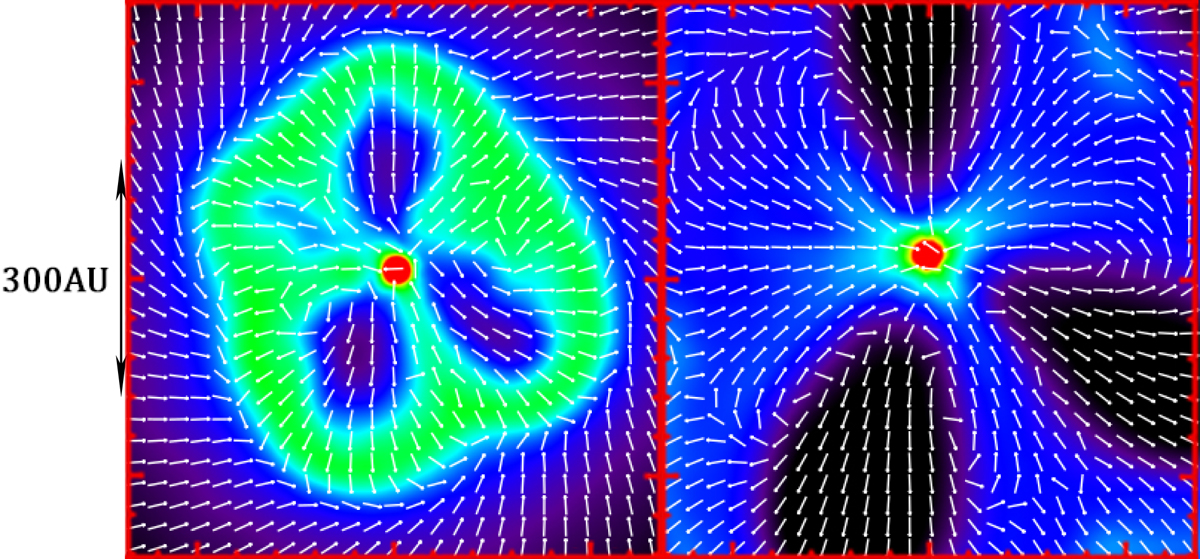
Magnetic interchange instability in the strong field case (μ = 2) for the GDSPH simulation with 503 resolution. Left panel: zoom-in of the disc structure seen face-on in Fig. 11 and right panel: same region at a later time. The white arrows show the direction of velocity and the colour scale indicates density. The instability launches magnetized bubbles in the azimuthal direction. At later times we can see that the central star starts to accrete again along the filamentary structure. These figures can be compared to the results from Krasnopolsky et al. (2012).
Current usage metrics show cumulative count of Article Views (full-text article views including HTML views, PDF and ePub downloads, according to the available data) and Abstracts Views on Vision4Press platform.
Data correspond to usage on the plateform after 2015. The current usage metrics is available 48-96 hours after online publication and is updated daily on week days.
Initial download of the metrics may take a while.