Fig. 9.
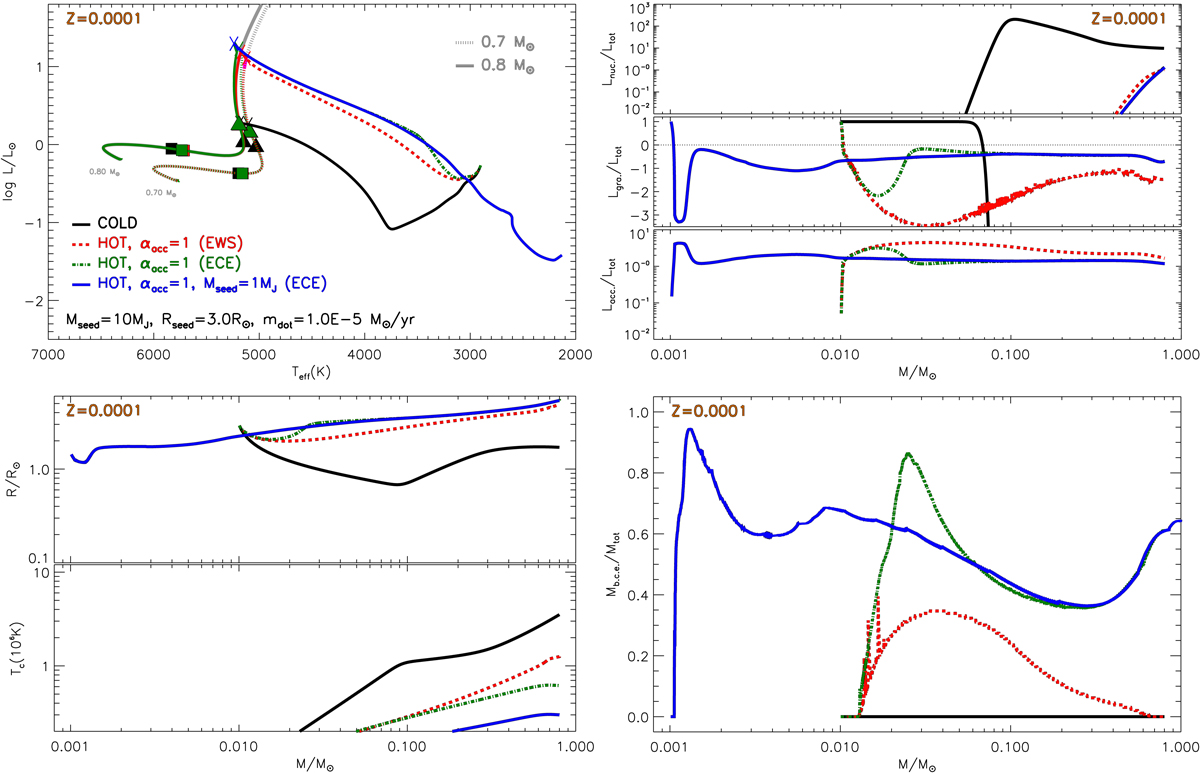
Evolution of hot accreting models with Z = 0.0001, final masses of Mfin = 0.7 and 0.8 M⊙, and ṁ = 10−5 M⊙ yr−1. Standard non-accreting models (grey lines) and reference cold LLC accreting models (Mseed = 10 MJ, Rseed = 3 R⊙, ṁ = 10−5 M⊙ yr−1, black line) are also shown for comparison purposes. Top left panel: HR diagram. The position of models at 1 Myr (filled triangles) and 10 Myr (filled squares), deuterium burning region (thick magenta line), and the end of the accretion phase (cross) are marked. Top right panel: relative contribution to the total luminosity of the nuclear burning (Lnuc.), gravitational contraction, and expansion (Lgra.) as well as accretion (Lacc.) as a function of the stellar mass during the protostellar accretion phase. Bottom left panel: evolution of the surface radius (in solar units) and central temperature (in units of 106 K) as a function of the stellar mass. Bottom right panel: relative mass coordinate at the bottom of the convective envelope as a function of the stellar mass.
Current usage metrics show cumulative count of Article Views (full-text article views including HTML views, PDF and ePub downloads, according to the available data) and Abstracts Views on Vision4Press platform.
Data correspond to usage on the plateform after 2015. The current usage metrics is available 48-96 hours after online publication and is updated daily on week days.
Initial download of the metrics may take a while.