Fig. 16.
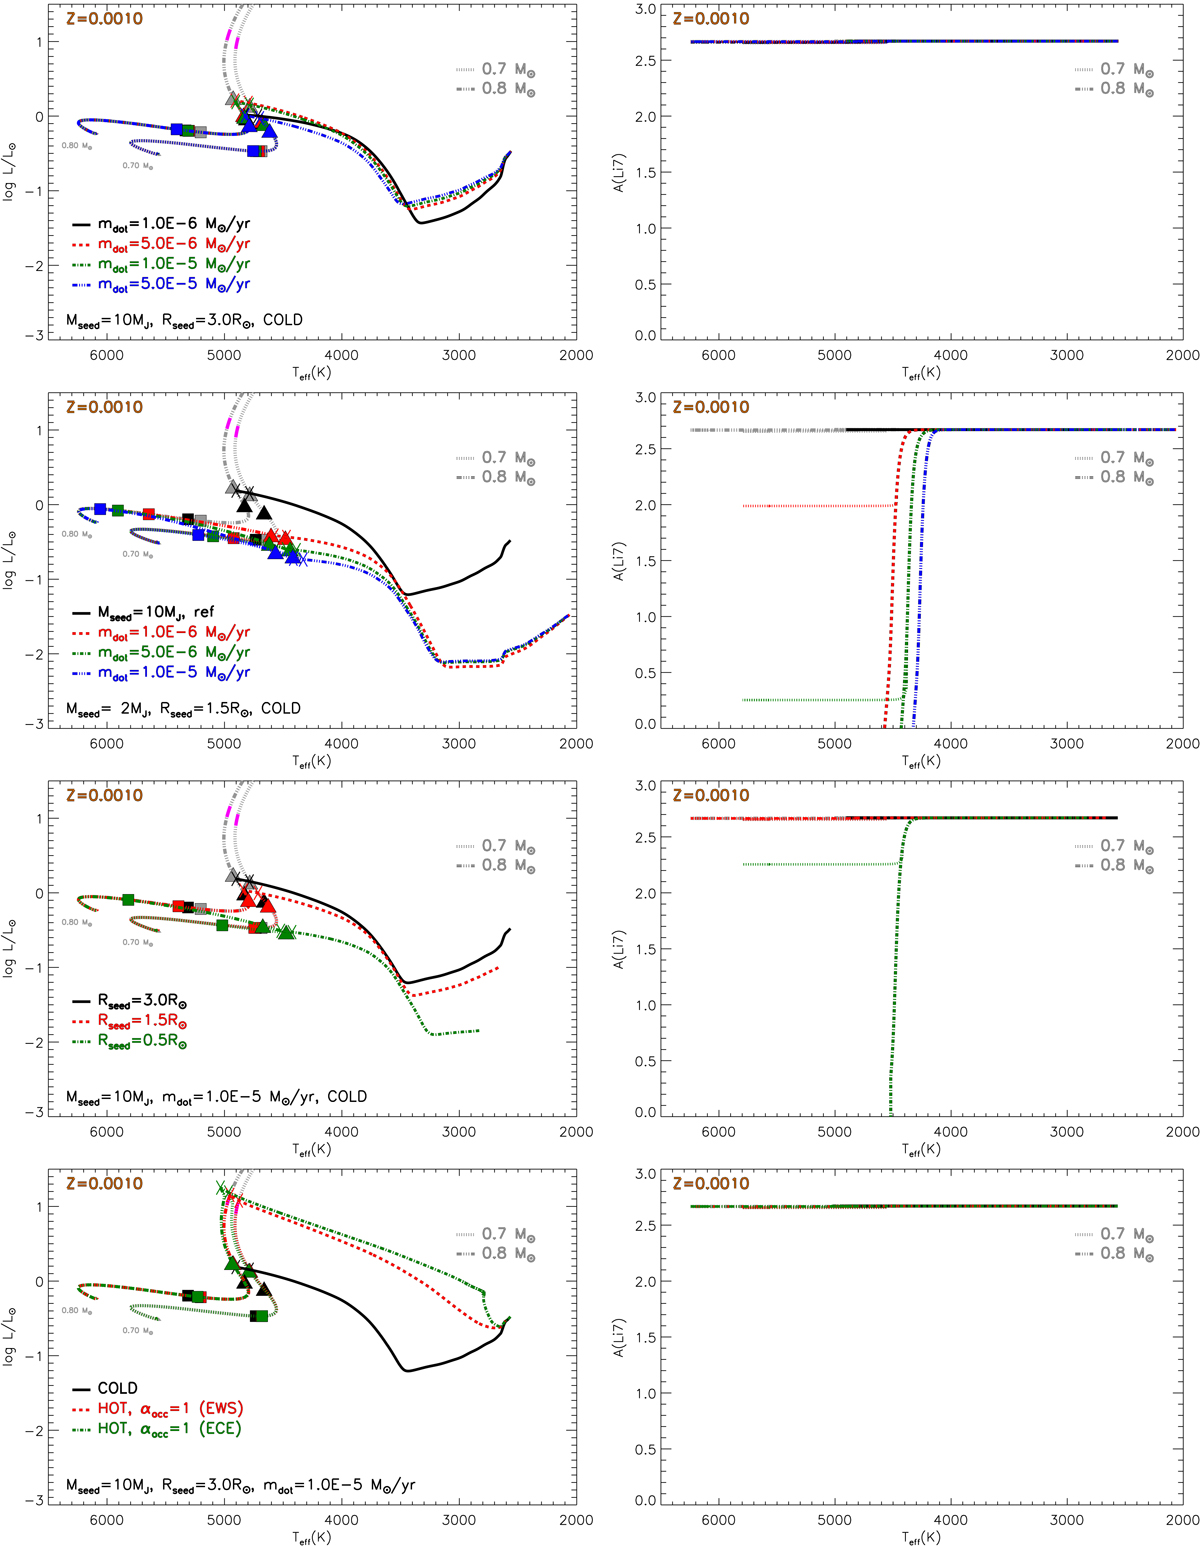
Evolution of accreting models with Z = 0.0010 in the HR diagram (left panels) and in the A(Li) versus Teff diagram (right panels). First row: dependence on the accretion rate for LLC models (Mseed = 10 MJ). Second row: dependence on the accretion rate for SLC models (Mseed = 1 MJ). Third row: dependence on Rseed. Bottom row: hot accretion models.
Current usage metrics show cumulative count of Article Views (full-text article views including HTML views, PDF and ePub downloads, according to the available data) and Abstracts Views on Vision4Press platform.
Data correspond to usage on the plateform after 2015. The current usage metrics is available 48-96 hours after online publication and is updated daily on week days.
Initial download of the metrics may take a while.