Fig. 11.
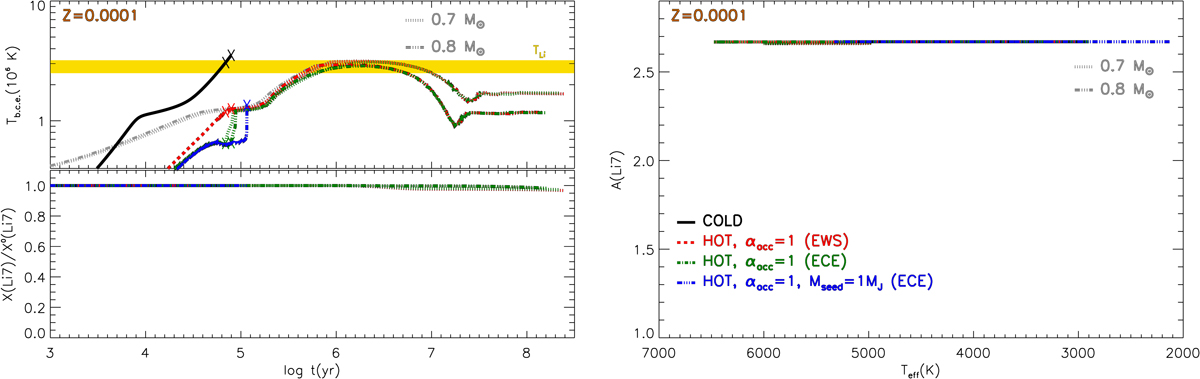
Temporal evolution of the temperature at the bottom of the convective envelope and surface lithium abundance (divided by the initial one, left panel) and surface A(Li) as a function of Teff (right panel) for the same hot ECE and EWS models shown in Fig. 9. The evolution of the reference cold accretion model (LLC, black line) is only shown during the accretion phase. The crosses mark the end of the accretion phase.
Current usage metrics show cumulative count of Article Views (full-text article views including HTML views, PDF and ePub downloads, according to the available data) and Abstracts Views on Vision4Press platform.
Data correspond to usage on the plateform after 2015. The current usage metrics is available 48-96 hours after online publication and is updated daily on week days.
Initial download of the metrics may take a while.