Fig. 9.
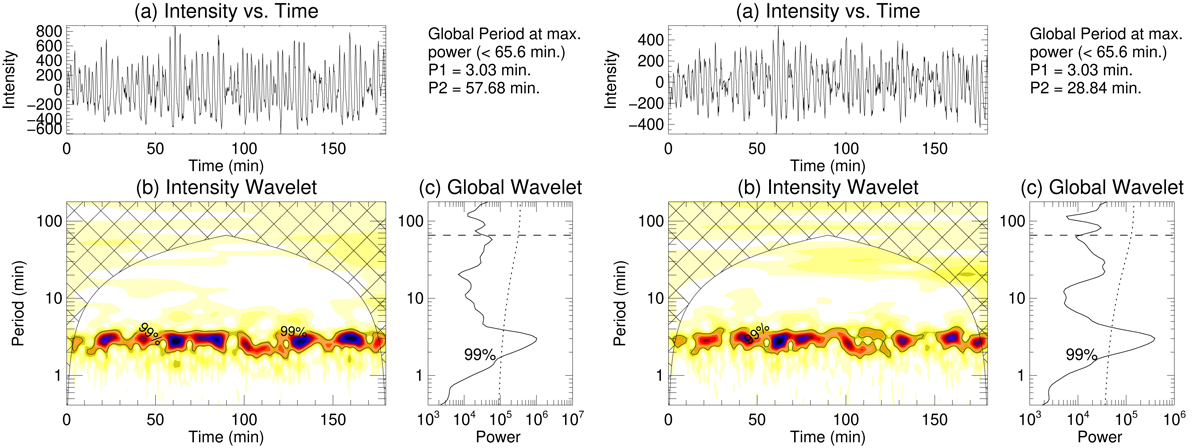
Wavelet analysis results of detrended light curves obtained from slit 1 AIA 171 Å time-distance map for locations L1 (left) and L3 (right) (location given in Fig. 4). Top panel: variation of obtained detrended intensity with time. Bottom left panel: corresponding wavelet spectrum (high power density in blue). Bottom right panel: global wavelet power spectrum. The dashed lines indicate the maximum period detectable from wavelet analysis due to cone-of-influence, whereas the dotted line indicates 99% confidence level curve. Periods P1 and P2 of the first two global power peaks are printed at the top right. On the time axis, the time starts at 7:30 UT.
Current usage metrics show cumulative count of Article Views (full-text article views including HTML views, PDF and ePub downloads, according to the available data) and Abstracts Views on Vision4Press platform.
Data correspond to usage on the plateform after 2015. The current usage metrics is available 48-96 hours after online publication and is updated daily on week days.
Initial download of the metrics may take a while.