Free Access
Fig. 4.
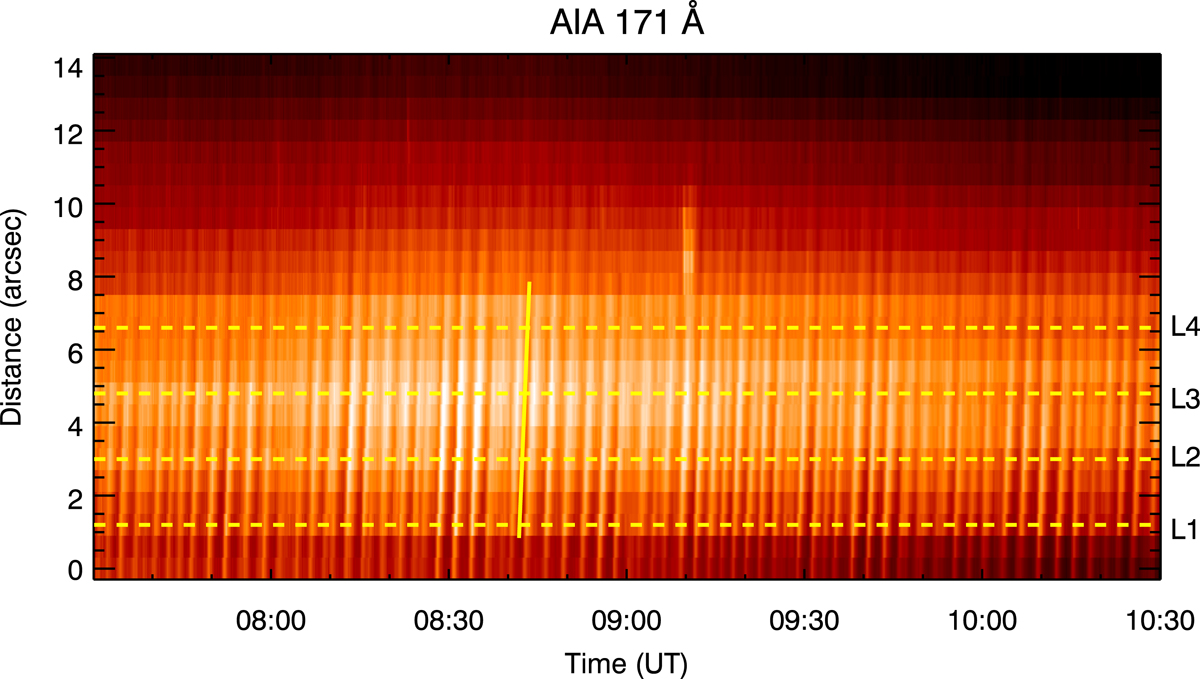
Time-distance map obtained along artificial slit 1 using 171 Å images. The yellow horizontal dashed lines show the locations used to obtain the light curves for further analysis. The slanted yellow line along the propagating feature is used to estimate average projected speed.
Current usage metrics show cumulative count of Article Views (full-text article views including HTML views, PDF and ePub downloads, according to the available data) and Abstracts Views on Vision4Press platform.
Data correspond to usage on the plateform after 2015. The current usage metrics is available 48-96 hours after online publication and is updated daily on week days.
Initial download of the metrics may take a while.