Fig. 3.
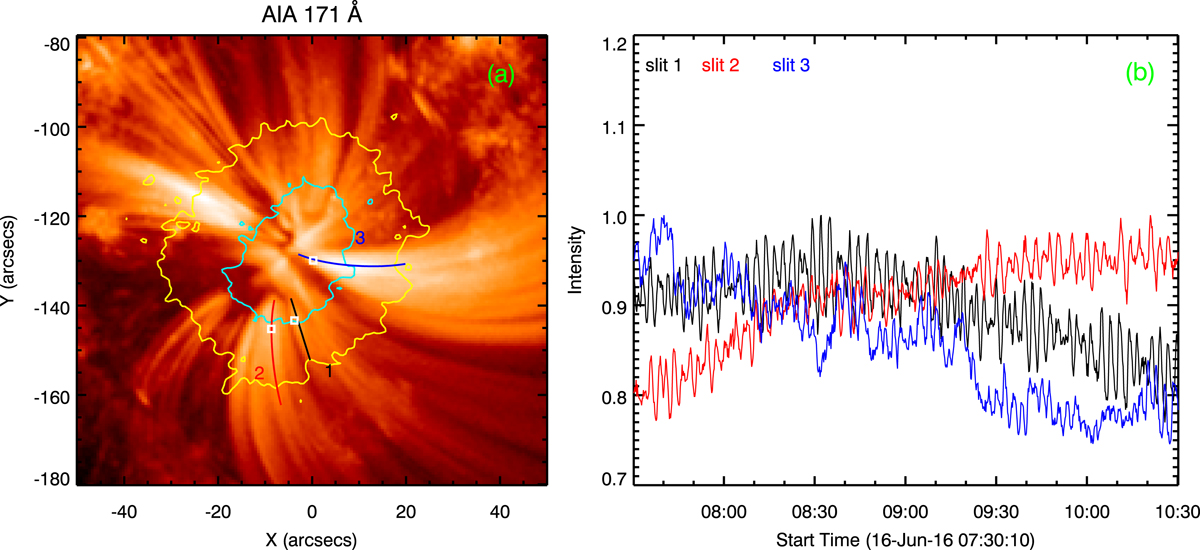
Panel a: fan loop system traced with black, red, and blue curved slits to perform time-distance analysis. The small white boxes locate the region used to study the steadiness of the fan loops. The contours are umbra–penumbra and penumbra–outer sunspot boundaries as described in Fig. 2. Panel b: normalised light curves in AIA 171 Å obtained for the white boxes shown in panel a.
Current usage metrics show cumulative count of Article Views (full-text article views including HTML views, PDF and ePub downloads, according to the available data) and Abstracts Views on Vision4Press platform.
Data correspond to usage on the plateform after 2015. The current usage metrics is available 48-96 hours after online publication and is updated daily on week days.
Initial download of the metrics may take a while.