Free Access
Fig. 12.
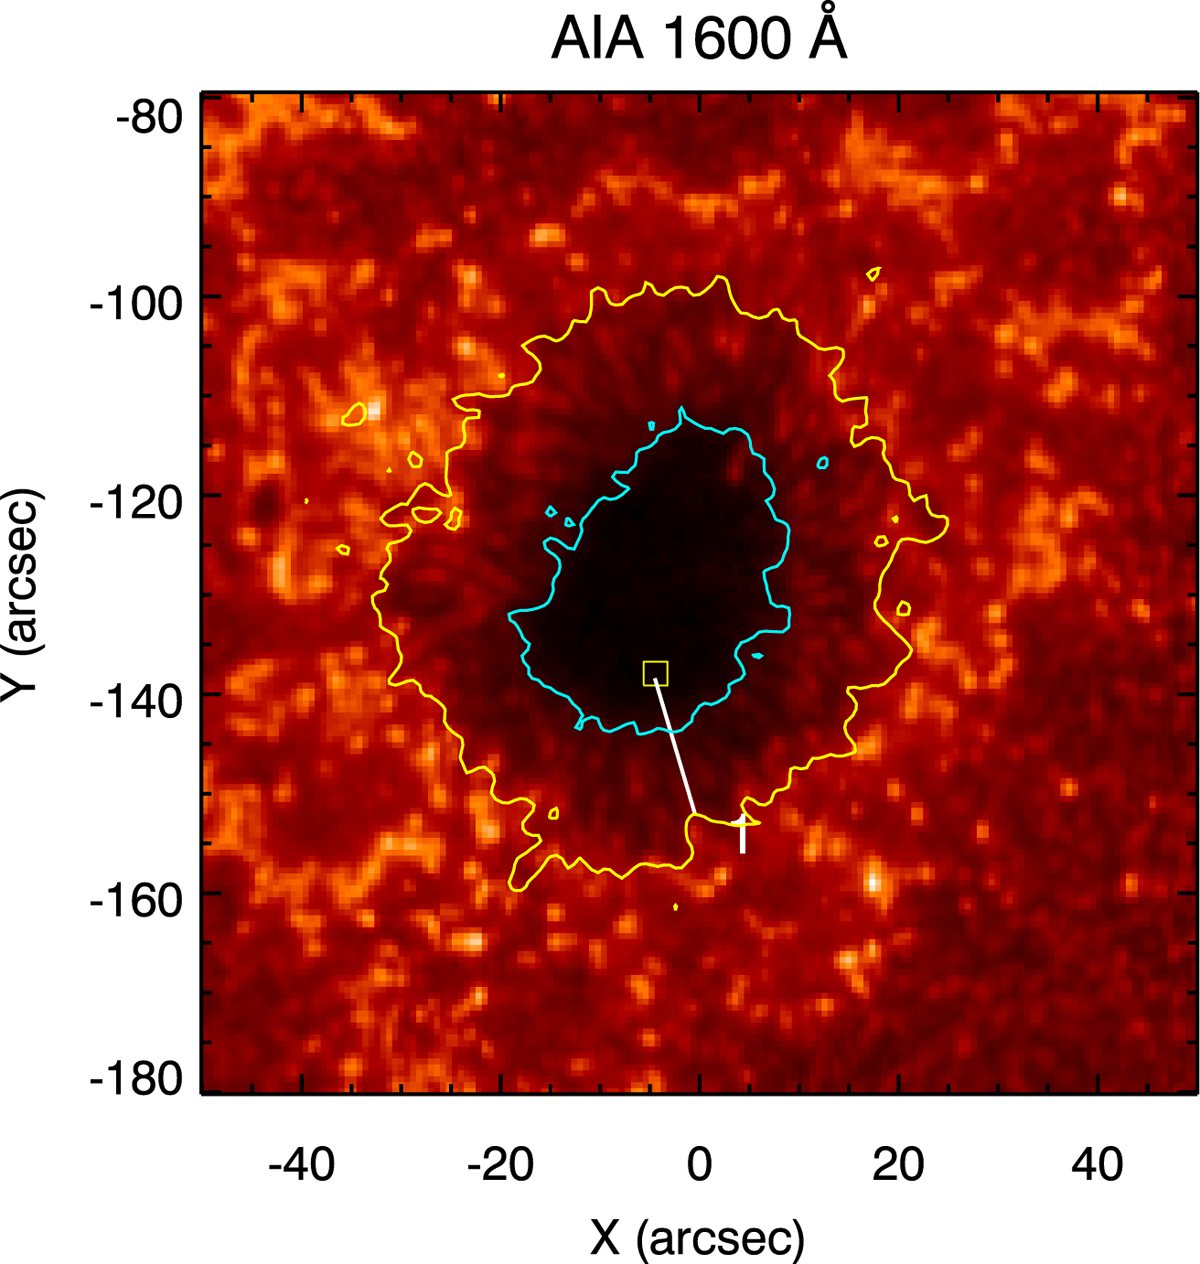
Sunspot umbra in AIA 1600 Å. The overplotted yellow box corresponds to the region at the footpoint of slit 1. The light curves averaged over the region are considered for further analysis in the chromospheric channels, e.g. AIA 304 Å and 1600 Å. Contours are similar to those described in panel a of Fig. 3.
Current usage metrics show cumulative count of Article Views (full-text article views including HTML views, PDF and ePub downloads, according to the available data) and Abstracts Views on Vision4Press platform.
Data correspond to usage on the plateform after 2015. The current usage metrics is available 48-96 hours after online publication and is updated daily on week days.
Initial download of the metrics may take a while.