Free Access
Fig. 1.
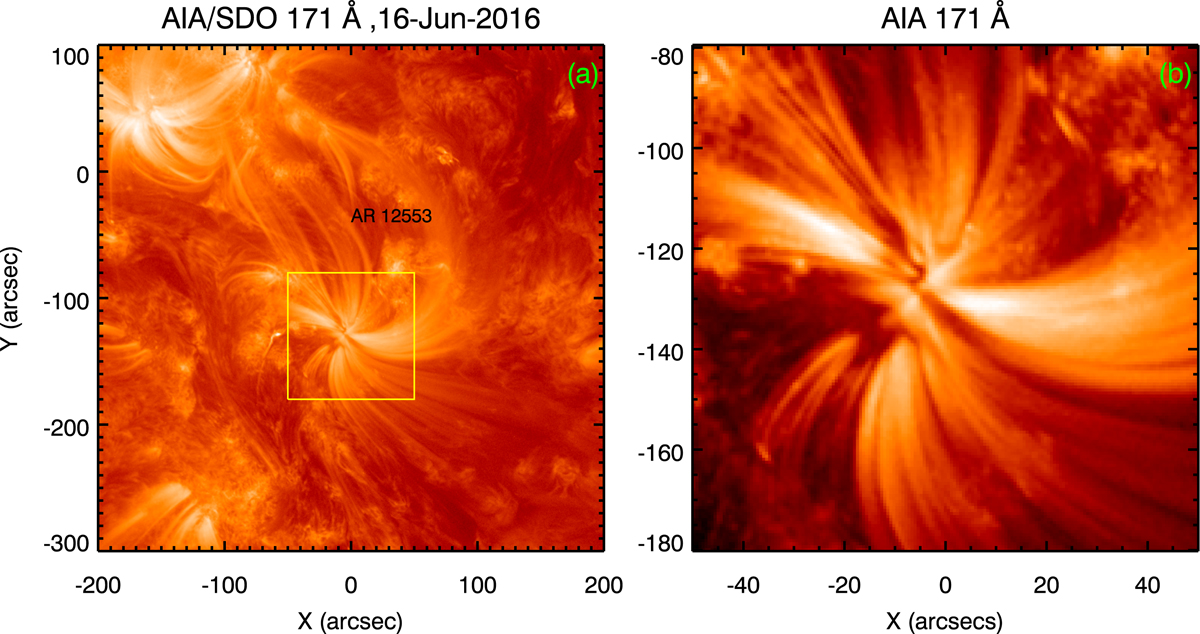
Panel a: AIA 171 Å image showing the active region. The yellow box encloses the fan loop system, the region of interest studied in this paper. Panel b: zoomed-in image corresponding to the yellow box shown in panel a.
Current usage metrics show cumulative count of Article Views (full-text article views including HTML views, PDF and ePub downloads, according to the available data) and Abstracts Views on Vision4Press platform.
Data correspond to usage on the plateform after 2015. The current usage metrics is available 48-96 hours after online publication and is updated daily on week days.
Initial download of the metrics may take a while.