Fig. 5.
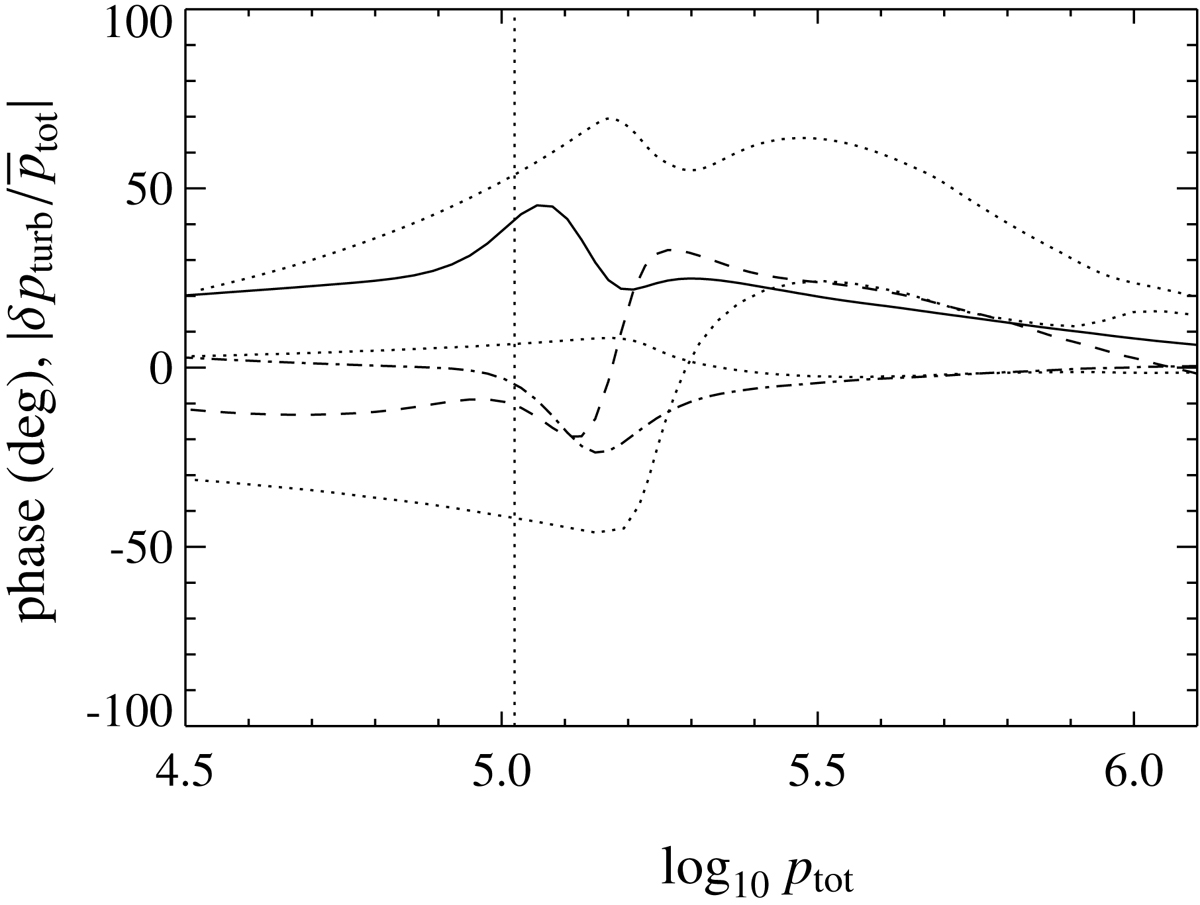
Quantities from Fig. 2 of Houdek et al. (2017) for the mode at 2815 μHz from case 11. The dashed line shows the phase difference between the Lagrangian density perturbation and the Lagrangian turbulent pressure perturbation. The dash-dotted line shows the phase difference relative to the Lagrangian gas pressure perturbation. The solid line shows the norm of the ratio of the Lagrangian turbulent pressure perturbation to the total pressure, which was multiplied by an arbitrary factor to match the range of the other quantities. The dotted lines show the same three quantities from Houdek et al. (2017).
Current usage metrics show cumulative count of Article Views (full-text article views including HTML views, PDF and ePub downloads, according to the available data) and Abstracts Views on Vision4Press platform.
Data correspond to usage on the plateform after 2015. The current usage metrics is available 48-96 hours after online publication and is updated daily on week days.
Initial download of the metrics may take a while.