Fig. 2.
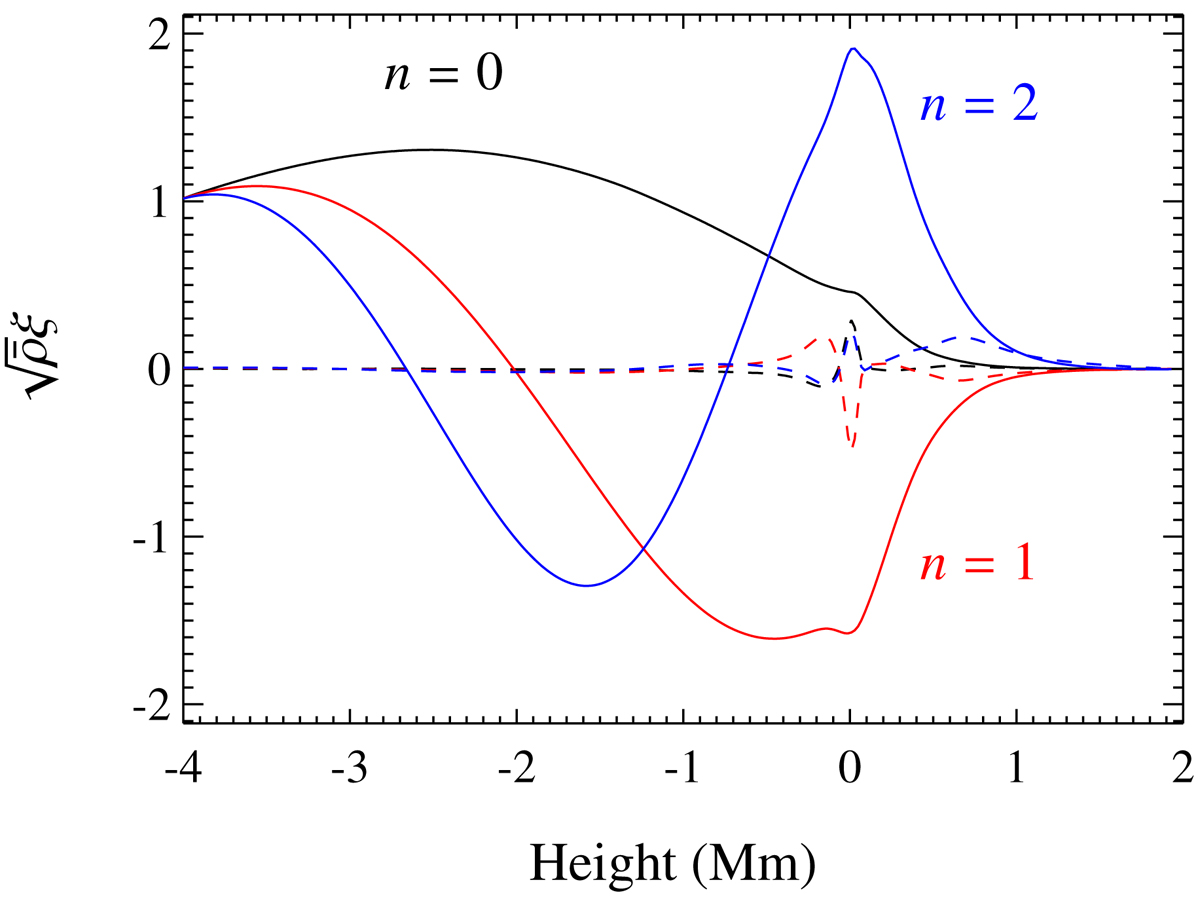
Displacement eigenfunctions corresponding to the three largest peaks in Fig. 1. The eigenfunctions were multiplied by the square root of the background density to improve the visibility and as the square of this quantity is proportional to the energy density. Colors indicate the different modes. Solid lines indicate the real part, and dashed lines illustrate the imaginary part. For ease of display, the scaled eigenfunctions were normalized to unity at the bottom boundary.
Current usage metrics show cumulative count of Article Views (full-text article views including HTML views, PDF and ePub downloads, according to the available data) and Abstracts Views on Vision4Press platform.
Data correspond to usage on the plateform after 2015. The current usage metrics is available 48-96 hours after online publication and is updated daily on week days.
Initial download of the metrics may take a while.