Fig. 1.
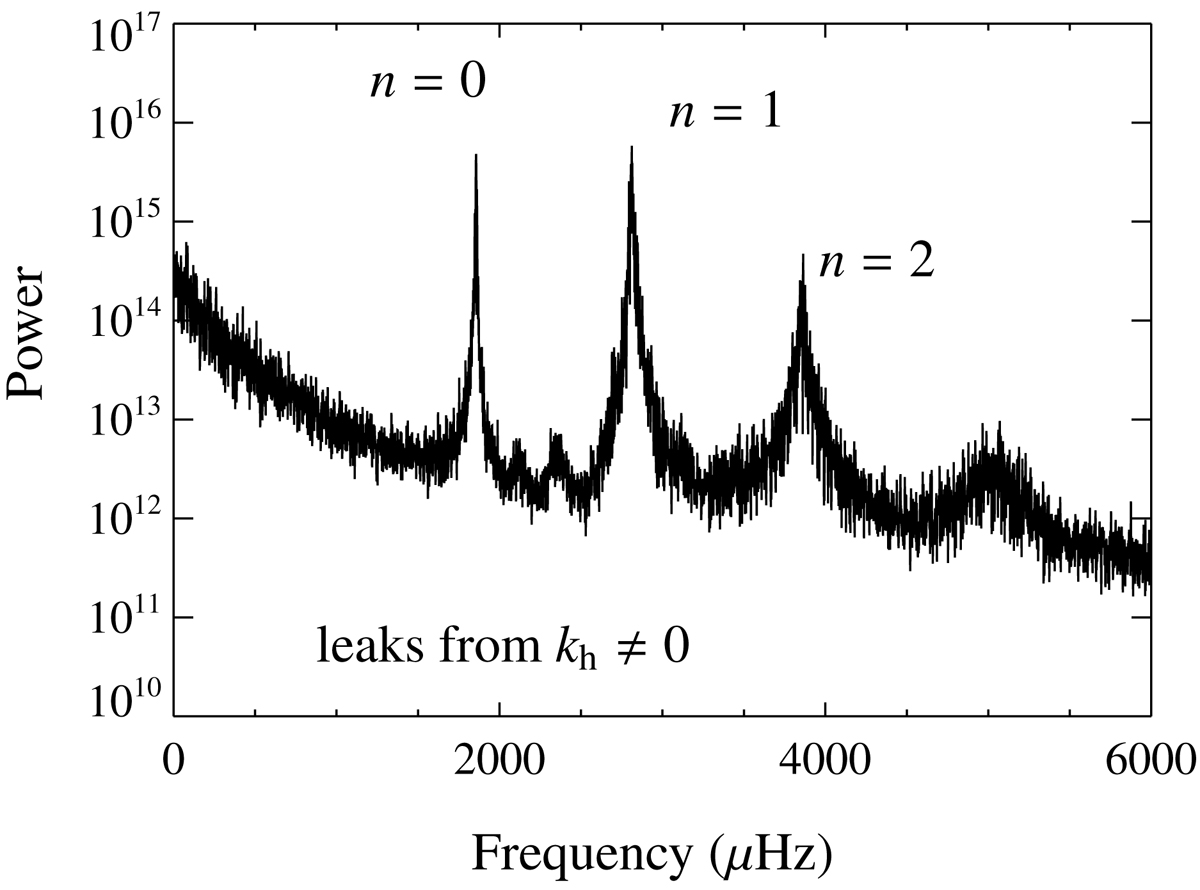
Power spectrum of the pressure perturbation for case 10, averaged over the depth range used for the SVD. The power was smoothed to reduce the effect of the stochastic excitation. The large peaks at 1856 μHz, 2812 μHz, and 3858 μHz represent the modes with n = 0, 1, and 2, respectively, where n is the number of nodes in the displacement eigenfunction. The n = 3 peak around 5000 μHz is not analyzed further, as it is very close to the acoustic cutoff frequency. The small peaks around 2100 μHz and 2300 μHz are leaks from modes with kh ≠ 0.
Current usage metrics show cumulative count of Article Views (full-text article views including HTML views, PDF and ePub downloads, according to the available data) and Abstracts Views on Vision4Press platform.
Data correspond to usage on the plateform after 2015. The current usage metrics is available 48-96 hours after online publication and is updated daily on week days.
Initial download of the metrics may take a while.