Fig. 9.
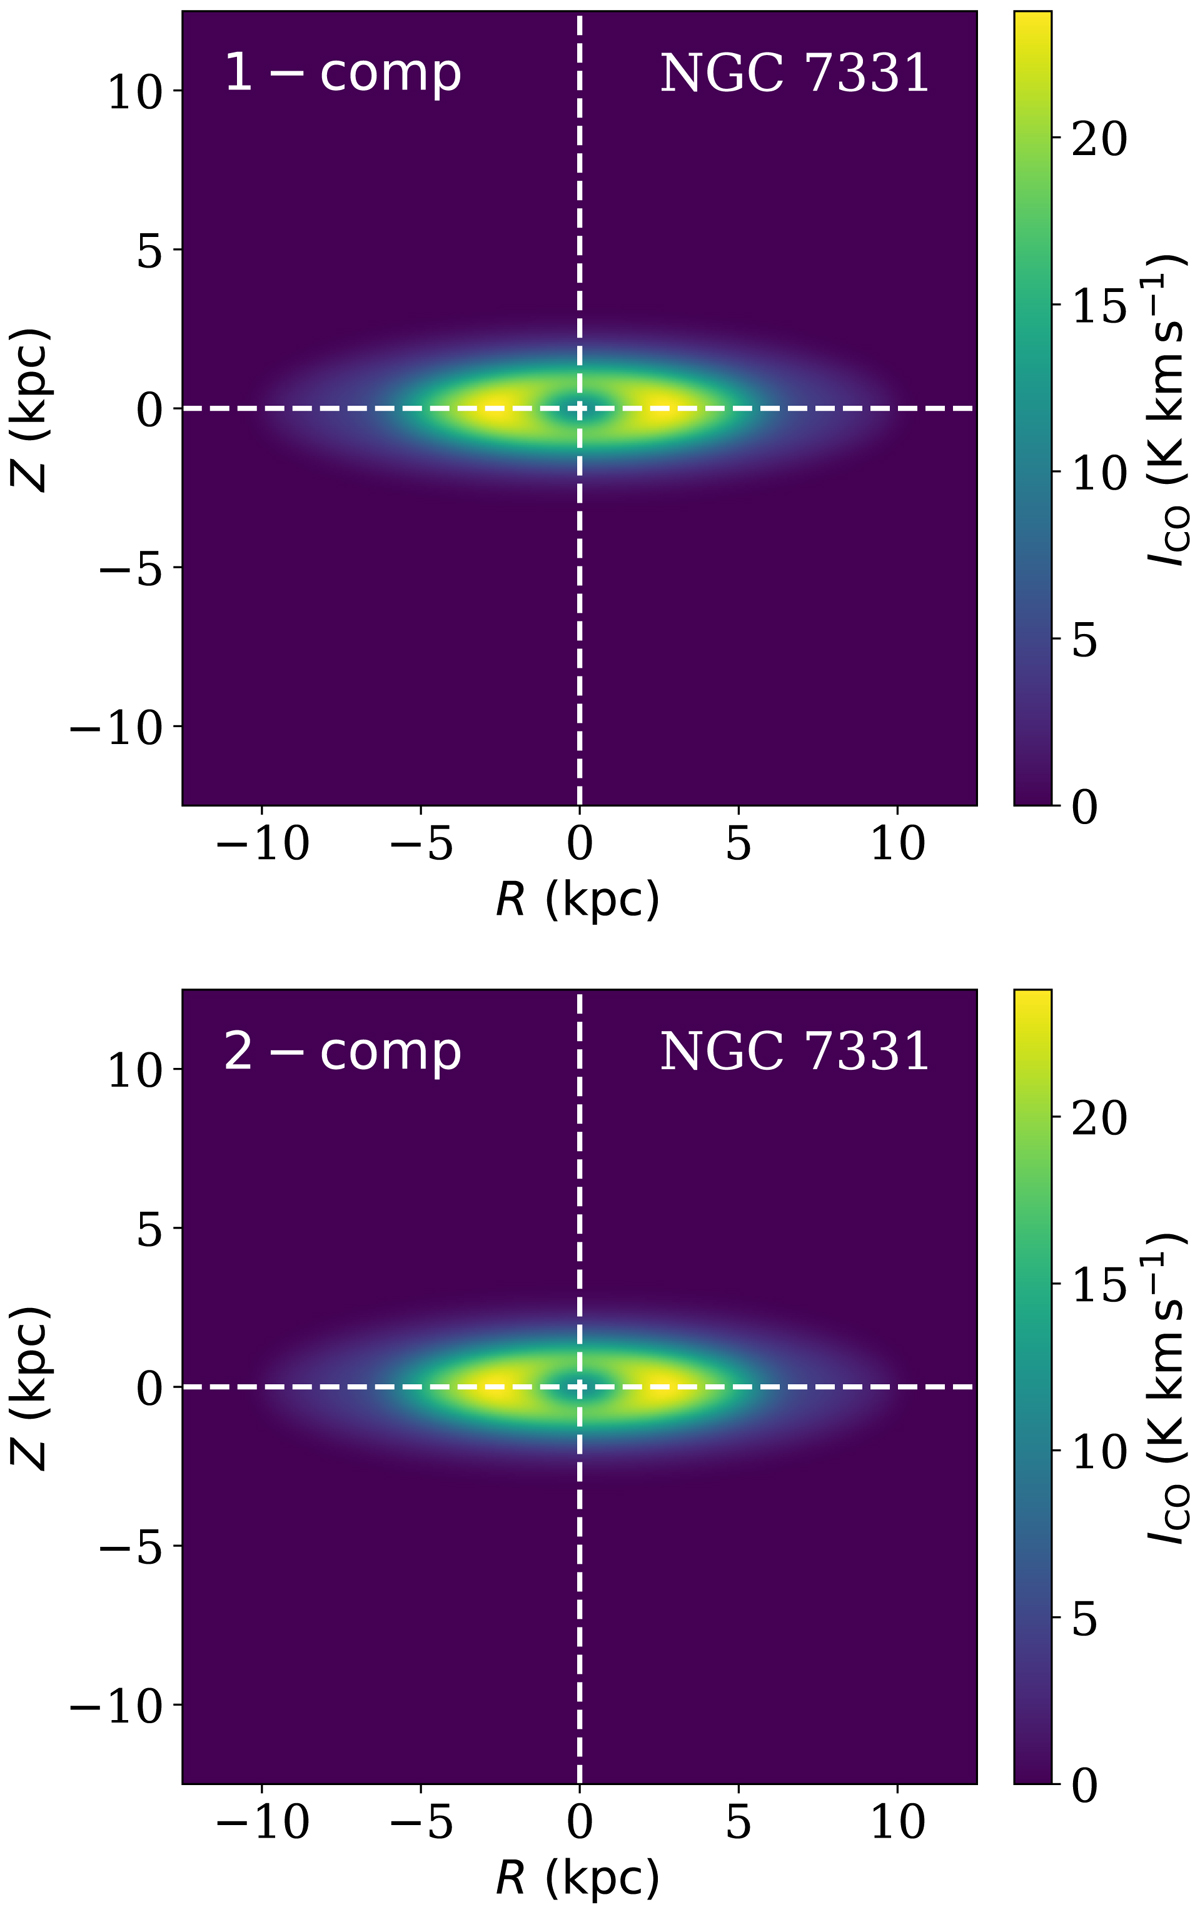
Modelled intensity maps for a single-component (top panel) and a two-component (bottom panel) molecular disc in NGC 7331. The colour scales in both of the panels indicate the observable CO intensity in the units of K km s−1. As can be seen, there is no apparent difference in the column density maps of the two discs. See the text for more details.
Current usage metrics show cumulative count of Article Views (full-text article views including HTML views, PDF and ePub downloads, according to the available data) and Abstracts Views on Vision4Press platform.
Data correspond to usage on the plateform after 2015. The current usage metrics is available 48-96 hours after online publication and is updated daily on week days.
Initial download of the metrics may take a while.