Fig. 8.
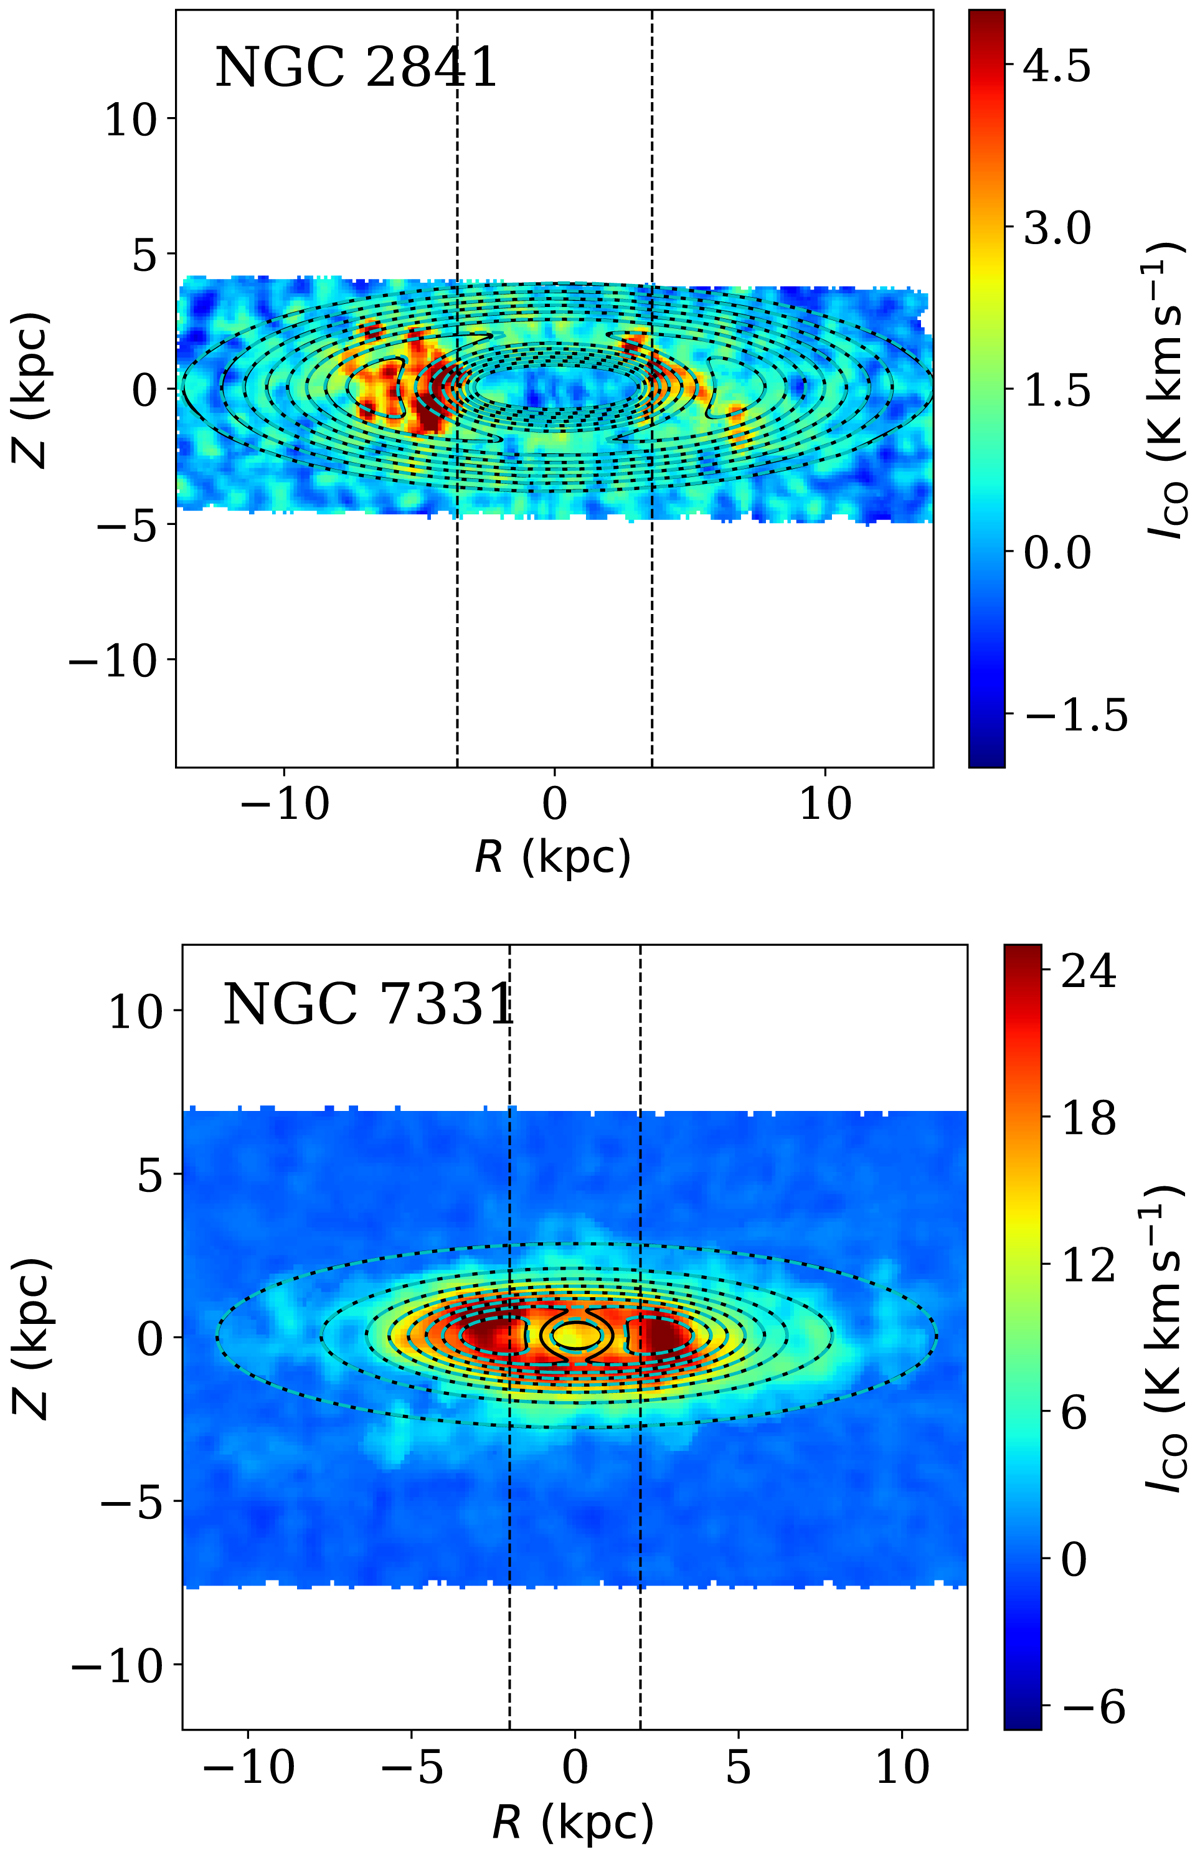
Modelled and observed molecular column density maps for NGC 2841 (top panel) and NGC 7331 (bottom panel). The colour scales in both of the panels represent the CO intensity distribution as observed in the HERACLES survey, whereas the contours represent the modelled intensity distribution. The contour levels are (1, 1.3, 1.6, 1.9, ...) K km s−1 for NGC 2841 and (1.5, 4.4, 7.4, ...) K km s−1 for NGC 7331. The solid contours represent the modelled intensity distribution for a two-component molecular disc, whereas the dashed contours indicate the same for a single-component molecular disc. The vertical dashed lines in each panel enclose a region where the solutions cannot be trusted due to a possible violation of the hydrostatic condition.
Current usage metrics show cumulative count of Article Views (full-text article views including HTML views, PDF and ePub downloads, according to the available data) and Abstracts Views on Vision4Press platform.
Data correspond to usage on the plateform after 2015. The current usage metrics is available 48-96 hours after online publication and is updated daily on week days.
Initial download of the metrics may take a while.