Fig. 7.
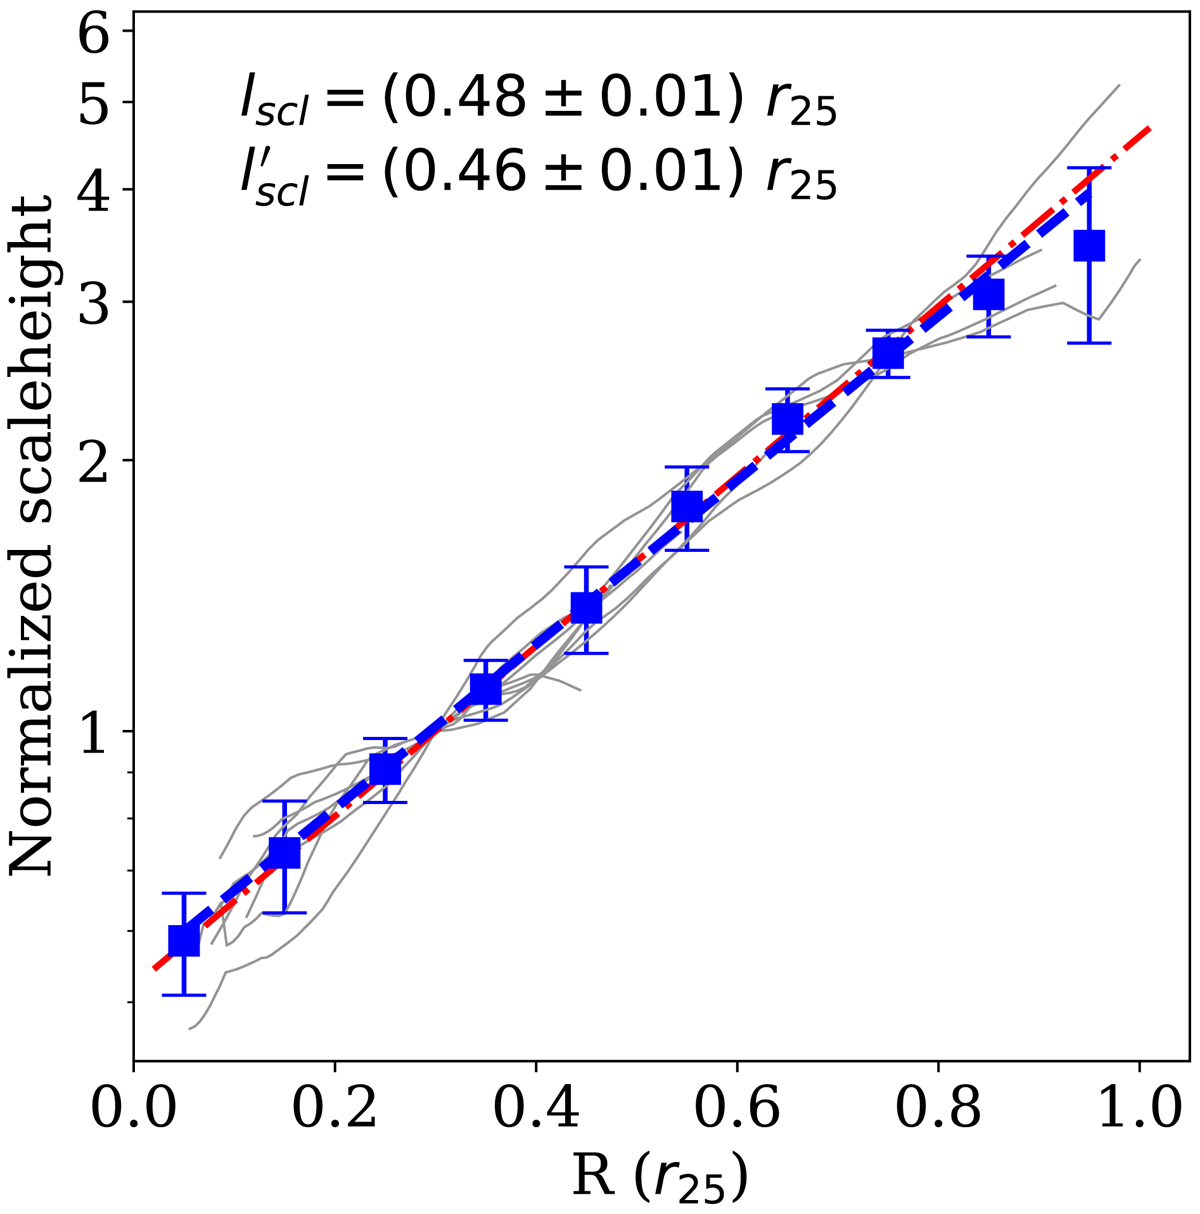
Normalised scale height profiles of our sample galaxies for two-component molecular discs. The solid thin lines represent the scale height profiles normalised to 1 at 0.3r25. The blue squares with error bars and the thick blue dashed line indicate the mean normalised scale heights and an exponential fit to it, respectively. The thick red dashed-dotted line shows an exponential fit to the normalised scale height profiles assuming single-component molecular discs in our sample galaxies. The respective scale lengths of the exponential fits are quoted in the top left of the figure. See the text for more details.
Current usage metrics show cumulative count of Article Views (full-text article views including HTML views, PDF and ePub downloads, according to the available data) and Abstracts Views on Vision4Press platform.
Data correspond to usage on the plateform after 2015. The current usage metrics is available 48-96 hours after online publication and is updated daily on week days.
Initial download of the metrics may take a while.