Fig. 5.
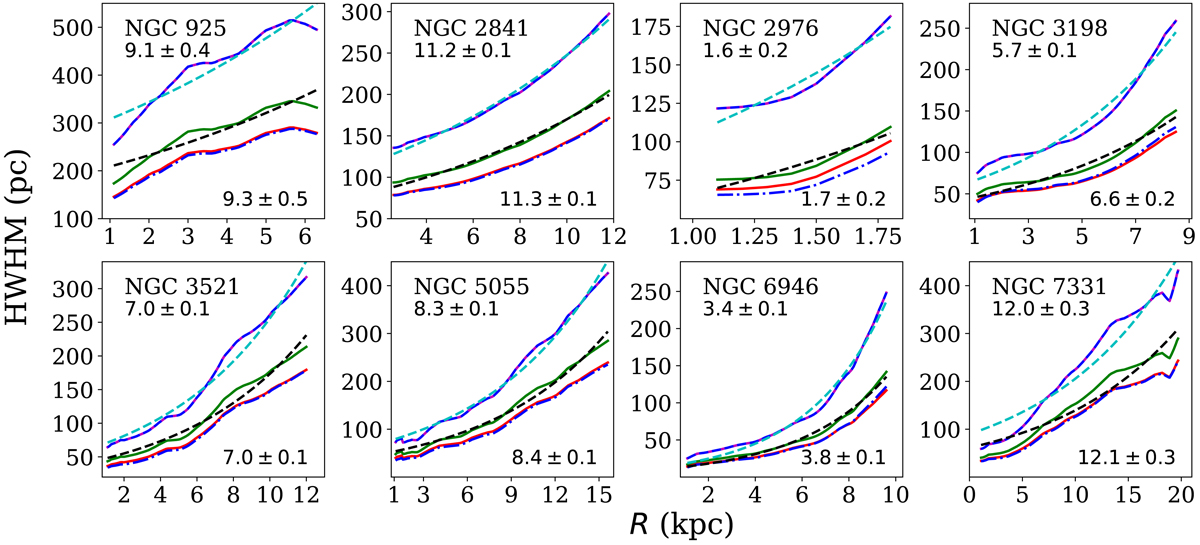
Atomic and molecular scale heights in our sample galaxies, assuming their molecular discs to be a two-component system. Each panel in the figure shows the scale heights for different galaxies, as mentioned in the top left corners of the respective panels. The solid red and magenta lines represent the scale heights for the thin and thick molecular discs, respectively, whereas the dashed blue lines show the atomic scale heights. The solid green lines represent the scale heights of the total molecular disc, that is, thin + thick. The cyan and black dashed lines show the exponential fits to the atomic and molecular scale heights. The respective scale lengths of the exponential fits are quoted in the top left (for atomic scale height) and the bottom right (for molecular scale height) corners of each panel in the units of kiloparsecs. For comparison purposes, the molecular scale heights assuming a single-component molecular disc in our sample galaxies are shown by the blue dashed-dotted lines.
Current usage metrics show cumulative count of Article Views (full-text article views including HTML views, PDF and ePub downloads, according to the available data) and Abstracts Views on Vision4Press platform.
Data correspond to usage on the plateform after 2015. The current usage metrics is available 48-96 hours after online publication and is updated daily on week days.
Initial download of the metrics may take a while.