Fig. 13.
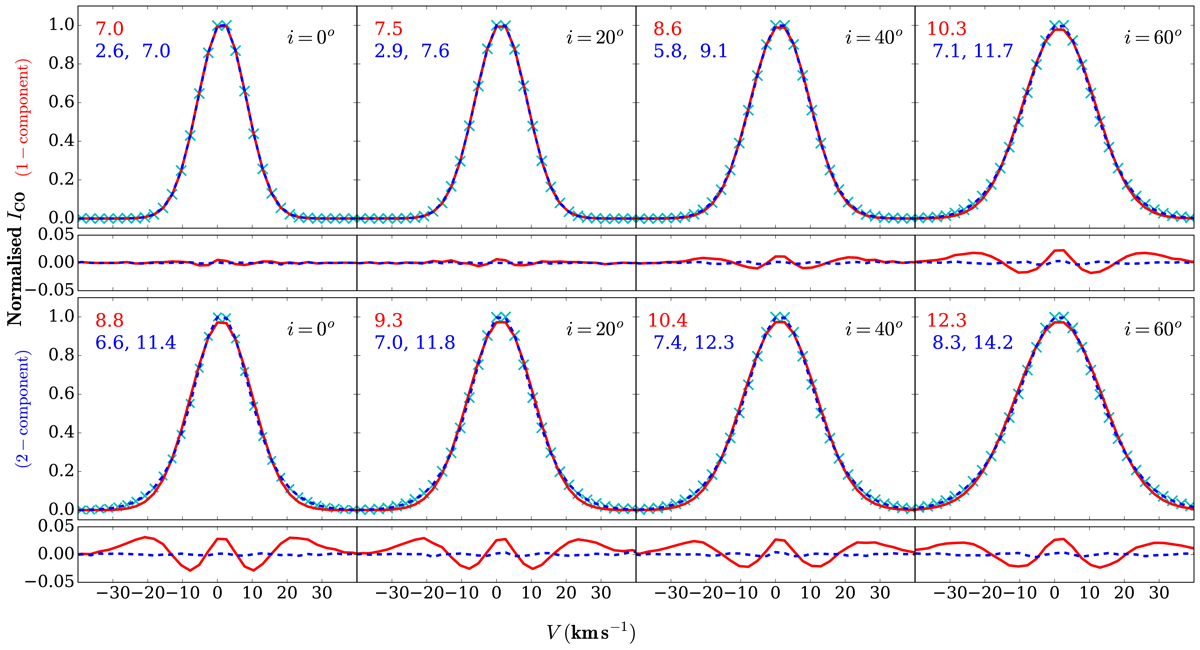
Result of Gaussian fittings to the stacked spectra of the single component and two-component molecular disc. Large top panels: stacked spectra and their fits with single and double Gaussians for the single-component disc at different inclinations, whereas large bottom panels: same for a two-component molecular disc. Smaller panels in the top and bottom: residuals of the respective fits. The cyan crosses represent the stacked spectra, whereas the solid red lines and the blue dashed lines represent a single Gaussian and a double Gaussian fit to the spectra, respectively. The widths of the fitted Gaussian components (sigma) are quoted in the top left corners of each panel. The first number on the left (in red) is the sigma of a single Gaussian fit, whereas the blue numbers just below them are the widths for a double Gaussian fit. The assumed inclinations of the molecular discs are quoted at the top right corners of the respective panels.
Current usage metrics show cumulative count of Article Views (full-text article views including HTML views, PDF and ePub downloads, according to the available data) and Abstracts Views on Vision4Press platform.
Data correspond to usage on the plateform after 2015. The current usage metrics is available 48-96 hours after online publication and is updated daily on week days.
Initial download of the metrics may take a while.