Fig. 12.
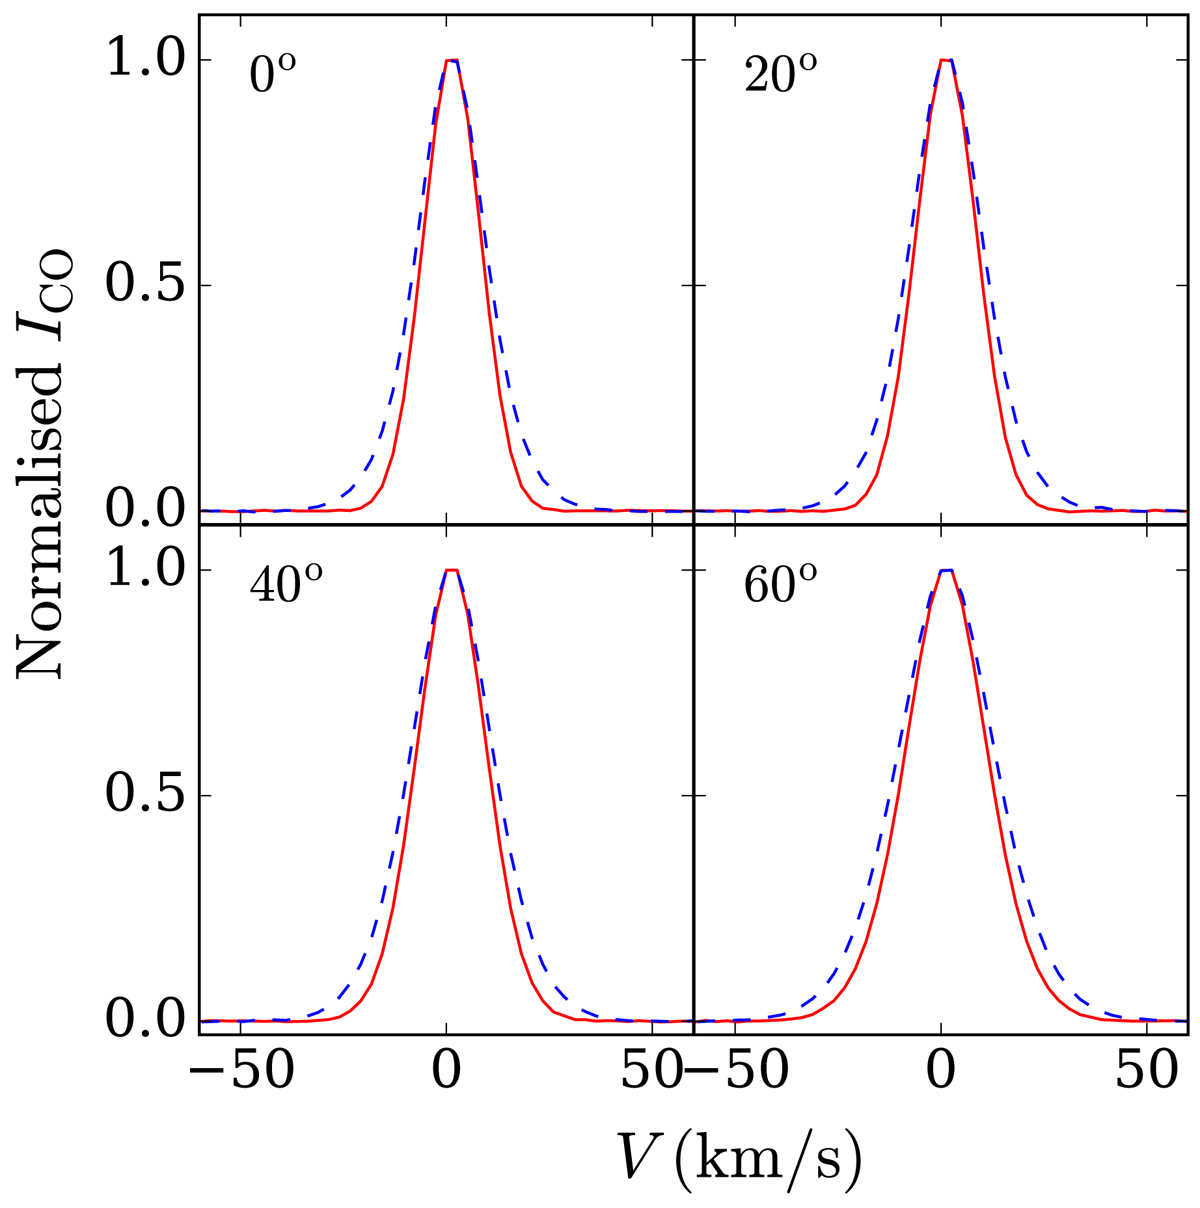
Comparison of the widths of normalised stacked spectra for a single-component and two-component molecular disc at different observing inclinations. The solid red lines indicate the stacked spectra for a single-component molecular disc, whereas the blue dashed lines show the same for a two-component disc. Different panels represent the effect of different assumed inclinations. The inclinations are quoted in the top left corners of the respective panels. The stacked spectra of a two-component molecular disc were found to produce a systematically higher width than that of a single-component disc. See the text for more details.
Current usage metrics show cumulative count of Article Views (full-text article views including HTML views, PDF and ePub downloads, according to the available data) and Abstracts Views on Vision4Press platform.
Data correspond to usage on the plateform after 2015. The current usage metrics is available 48-96 hours after online publication and is updated daily on week days.
Initial download of the metrics may take a while.