Open Access
Fig. A.1.
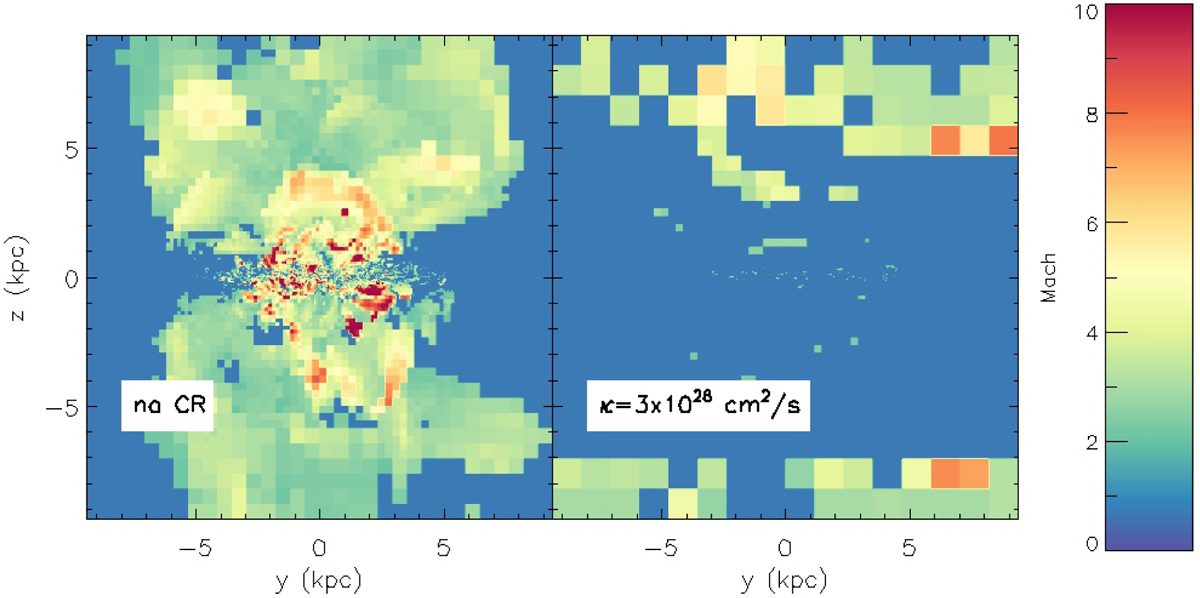
Edge-on view of the maximum value of the Mach number along the line of sight for the simulation without CRs (left panel) and the simulation with CR and anisotropic diffusion with κ = 3 × 1028 cm2 s−1 (right panel) for the G9 simulation at time t = 250 Myr.
Current usage metrics show cumulative count of Article Views (full-text article views including HTML views, PDF and ePub downloads, according to the available data) and Abstracts Views on Vision4Press platform.
Data correspond to usage on the plateform after 2015. The current usage metrics is available 48-96 hours after online publication and is updated daily on week days.
Initial download of the metrics may take a while.